

Question: Kindly help me to plot the d2 and s2 in the graph as I don't know how to do it if the supply increase by
Kindly help me to plot the d2 and s2 in the graph as I don't know how to do it if the supply increase by 350 and the demand increased by 100
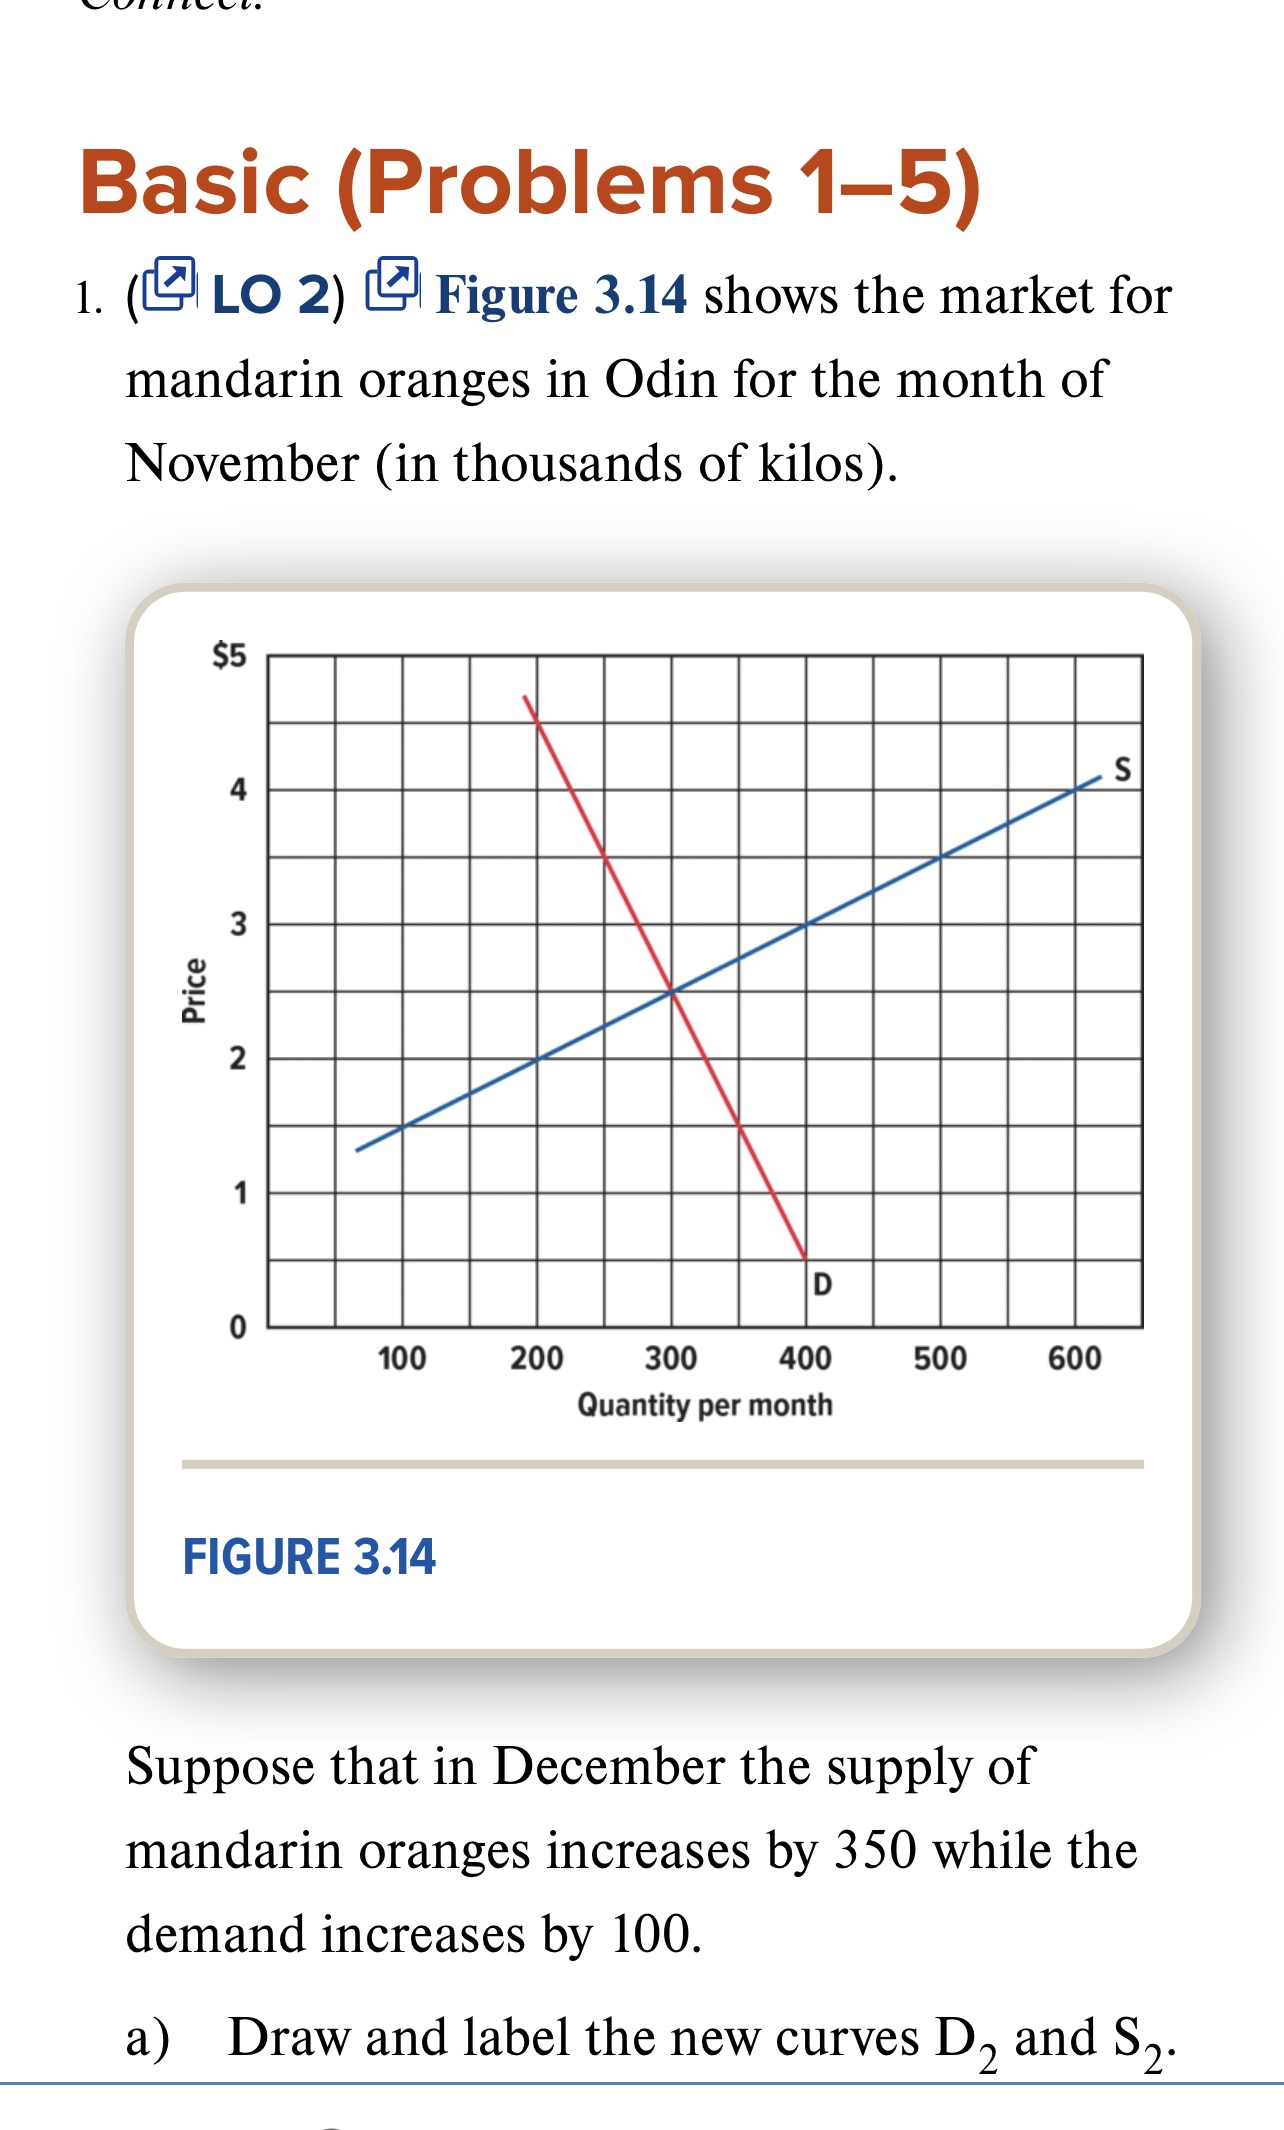
VUI ll va0. Basic (Problems 15) 1. (. LO 2) it Figure 3.14 shows the market for mandarin oranges in Odin for the month of November (in thousands of kilos). 100 200 300 400 500 600 Quantity per month FIGURE 3.14 Suppose that in December the supply of mandarin oranges increases by 350 while the demand increases by 100. a) Draw and label the new curves D2 and S2
Step by Step Solution
There are 3 Steps involved in it
1 Expert Approved Answer
Step: 1 Unlock

Question Has Been Solved by an Expert!
Get step-by-step solutions from verified subject matter experts
Step: 2 Unlock
Step: 3 Unlock