

Question: kindly help to solve the question. Required information The Hard Rock Mining Company is developing cost formulas for management planning and decision-making purposes. The company's
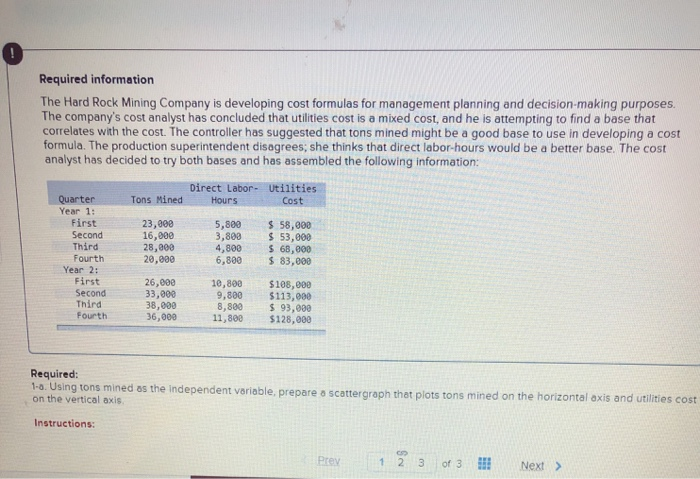
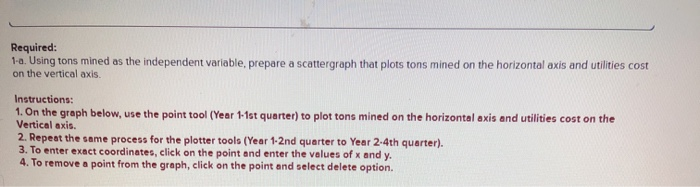
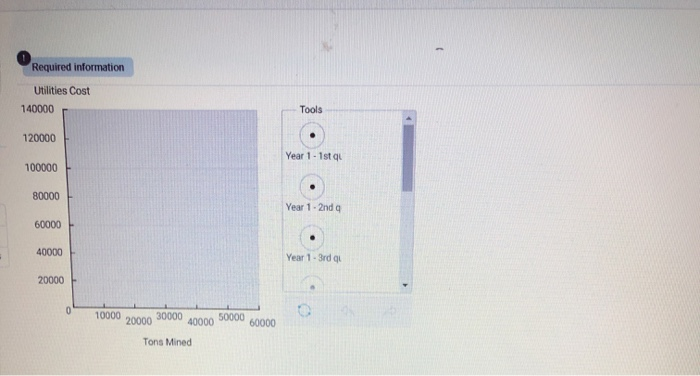
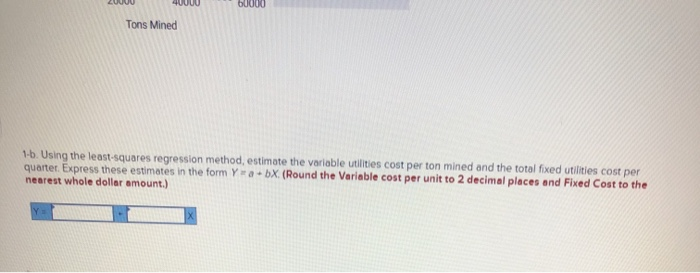
Required information The Hard Rock Mining Company is developing cost formulas for management planning and decision-making purposes. The company's cost analyst has concluded that utilities cost is a mixed cost, and he is attempting to find a base that correlates with the cost. The controller has suggested that tons mined might be a good base to use in developing a cost formula. The production superintendent disagrees, she thinks that direct labor-hours would be a better base. The cost analyst has decided to try both bases and has assembled the following information: Direct Labor. Utilities Quarter Tons Mined Hours Cost Year 1: First 23,000 5,880 $ 58,000 Second 16,000 3,800 $ 53,000 Third 28,800 4,800 $ 68,000 Fourth 20,000 6,800 $ 83,000 Year 2: First 26,000 10,800 $108,000 Second 33,000 9,800 $113,000 Third 38,000 8,880 $ 93,000 Fourth 36,000 11,800 $128,000 Required: 1-0. Using tons mined as the independent variable, prepare o scattergraph that plots tons mined on the horizontal axis and utilities cost on the vertical axis. Instructions: Prev 1 NS 3 of 3 HII Next > Required: 1-a. Using tons mined as the independent variable, prepare a scattergraph that plots tons mined on the horizontal axis and utilities cost on the vertical axis. Instructions: 1. On the graph below, use the point tool (Year 1-1st quarter) to plot tons mined on the horizontal axis and utilities cost on the Vertical axis. 2. Repeat the same process for the plotter tools (Year 1-2nd quarter to Year 2.4th quarter). 3. To enter exact coordinates, click on the point and enter the values of x and y. 4. To remove a point from the graph, click on the point and select delete option. Required information Utilities Cost 140000 Tools 120000 Year 1 - 1st 100000 80000 Year 1. 2nd a 60000 40000 Year 1 - 3rd 20000 0 10000 20000 30000 40000 50000 60000 Tons Mined 40000 60000 Tons Mined 1-6. Using the least-squares regression method, estimate the variable utilities cost per ton mined and the total fixed utilities cost per quarter. Express these estimates in the form Ya+bX. (Round the Variable cost per unit to 2 decimal places and Fixed Cost to the nearest whole dollar amount.) 2-b. Using the least-squares regression method, estimate the variable utilities cost per direct labor-hour and the total fixed utilities cost per quarter . Express these estimates in the form Y = a + bx (Round the Variable cost to 2 decimal places and Fixed Cost to the nearest whole dollar amount.)
Step by Step Solution
There are 3 Steps involved in it

Get step-by-step solutions from verified subject matter experts