

Question: Kindly interpret the following research data: Data 1: The Day The Respondents Gave Birth To Their Eldest DAY OF THE WEEK Statistics Cumulative DAY OF
Kindly interpret the following research data:
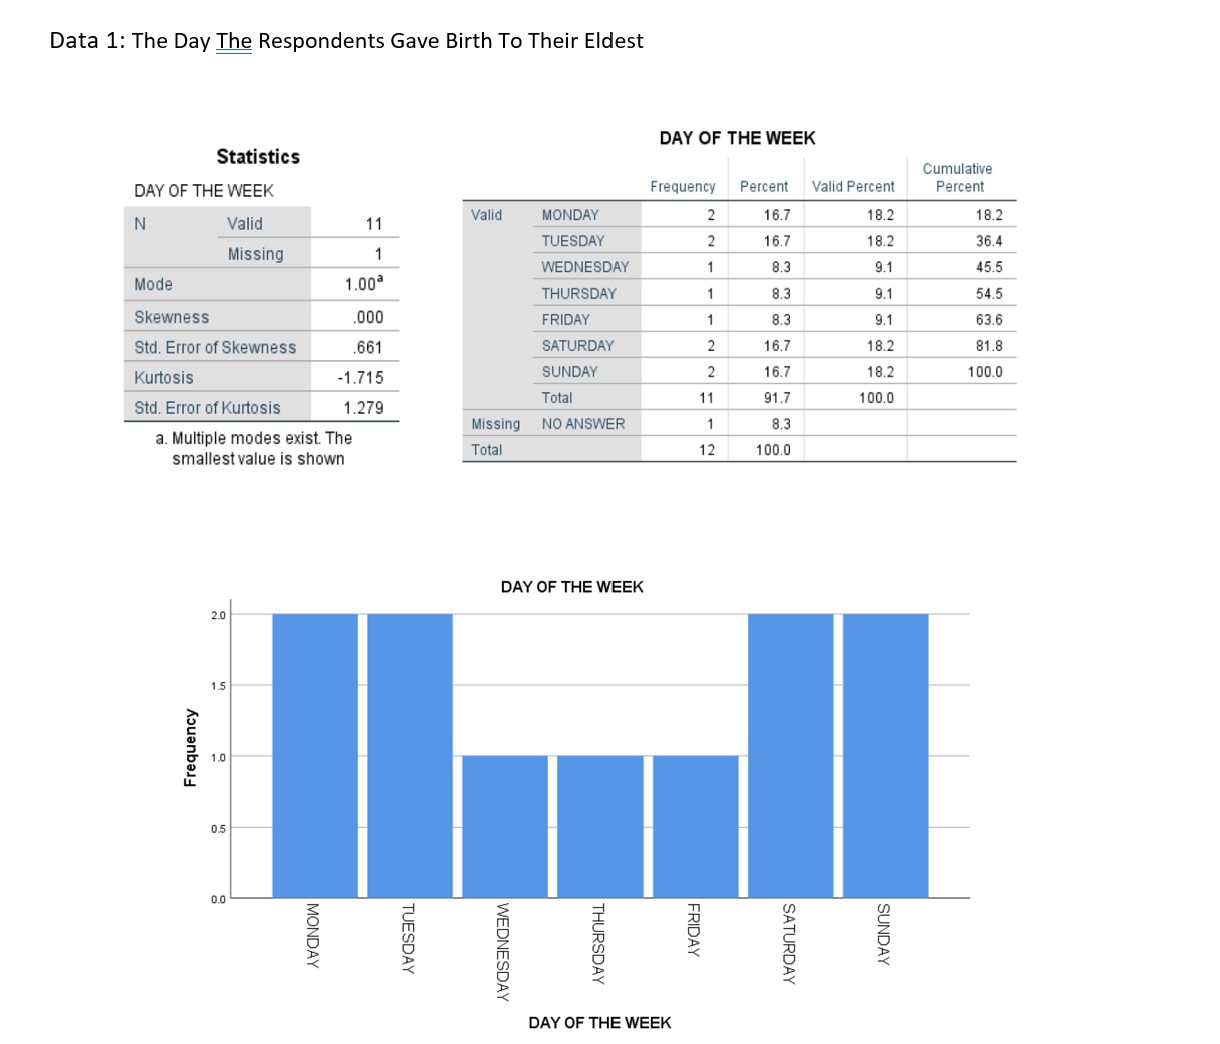
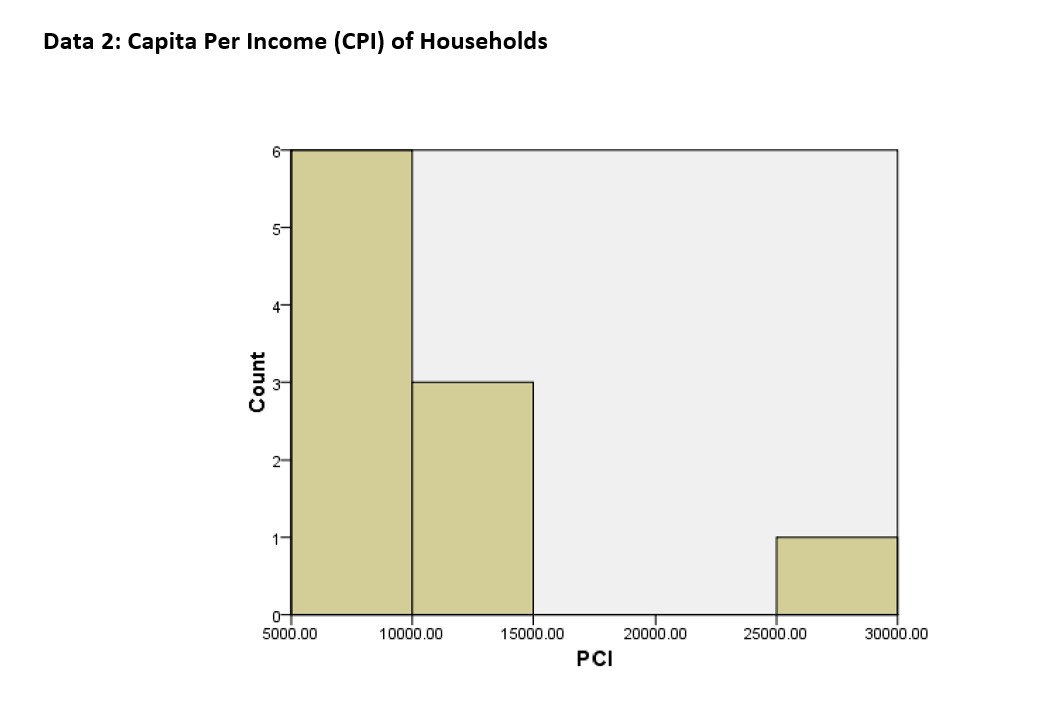
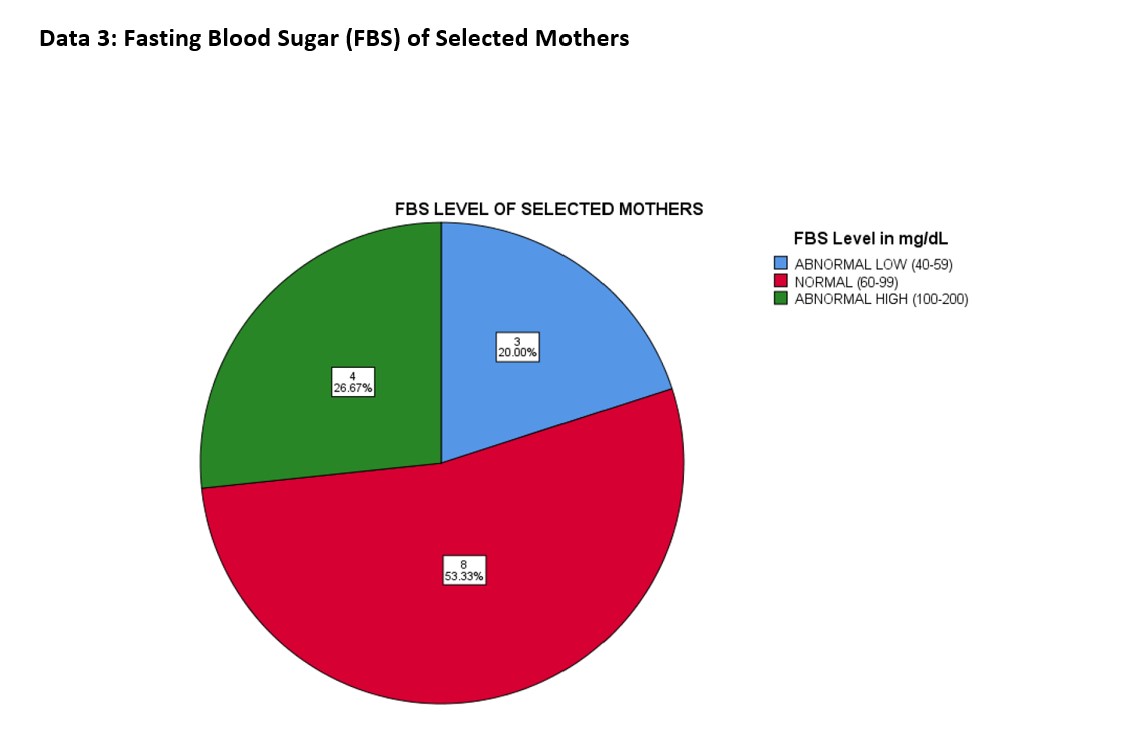
Data 1: The Day The Respondents Gave Birth To Their Eldest DAY OF THE WEEK Statistics Cumulative DAY OF THE WEEK Frequency Percent Valid Percent Percent N Valid Valid 11 MONDAY 2 16.7 18.2 18.2 TUESDAY 2 16.7 18.2 36.4 Missing WEDNESDAY 8.3 9.1 45.5 Mode 1.00a THURSDAY 8.3 9.1 54.5 Skewness 000 FRIDAY 8.3 9.1 63.6 Std. Error of Skewness .661 SATURDAY 16.7 18.2 81.8 N N Kurtosis -1.715 SUNDAY 16.7 18.2 100.0 Std. Error of Kurtosis 1.279 Total 11 91.7 100.0 Missing NO ANSWER 8.3 a. Multiple modes exist. The Total 12 smallest value is shown 100.0 DAY OF THE WEEK 2.0 1.5 Frequency .0 0.5 FRIDAY MONDAY SUNDAY TUESDAY THURSDAY SATURDAY WEDNESDAY DAY OF THE WEEKData 2: Capita Per Income (CPI) of Households 5- 4- Count 3- 2- 0- 5000.00 10000.00 15000.00 20000.00 25000.00 30000.00 PCIData 3: Fasting Blood Sugar (FBS) of Selected Mothers FBS LEVEL OF SELECTED MOTHERS FBS Level in mg/dL ABNORMAL LOW (40-59) NORMAL (60-99) ABNORMAL HIGH (100-200) 3 20.00% 4 26.67% 8 53,33%
Step by Step Solution
There are 3 Steps involved in it

Get step-by-step solutions from verified subject matter experts