

Question: Kindly plot on the graph how they have concluded 50 and 600 Price 8 8 8 2 8 8 9 8 8 9 200 400
Kindly plot on the graph how they have concluded 50 and 600
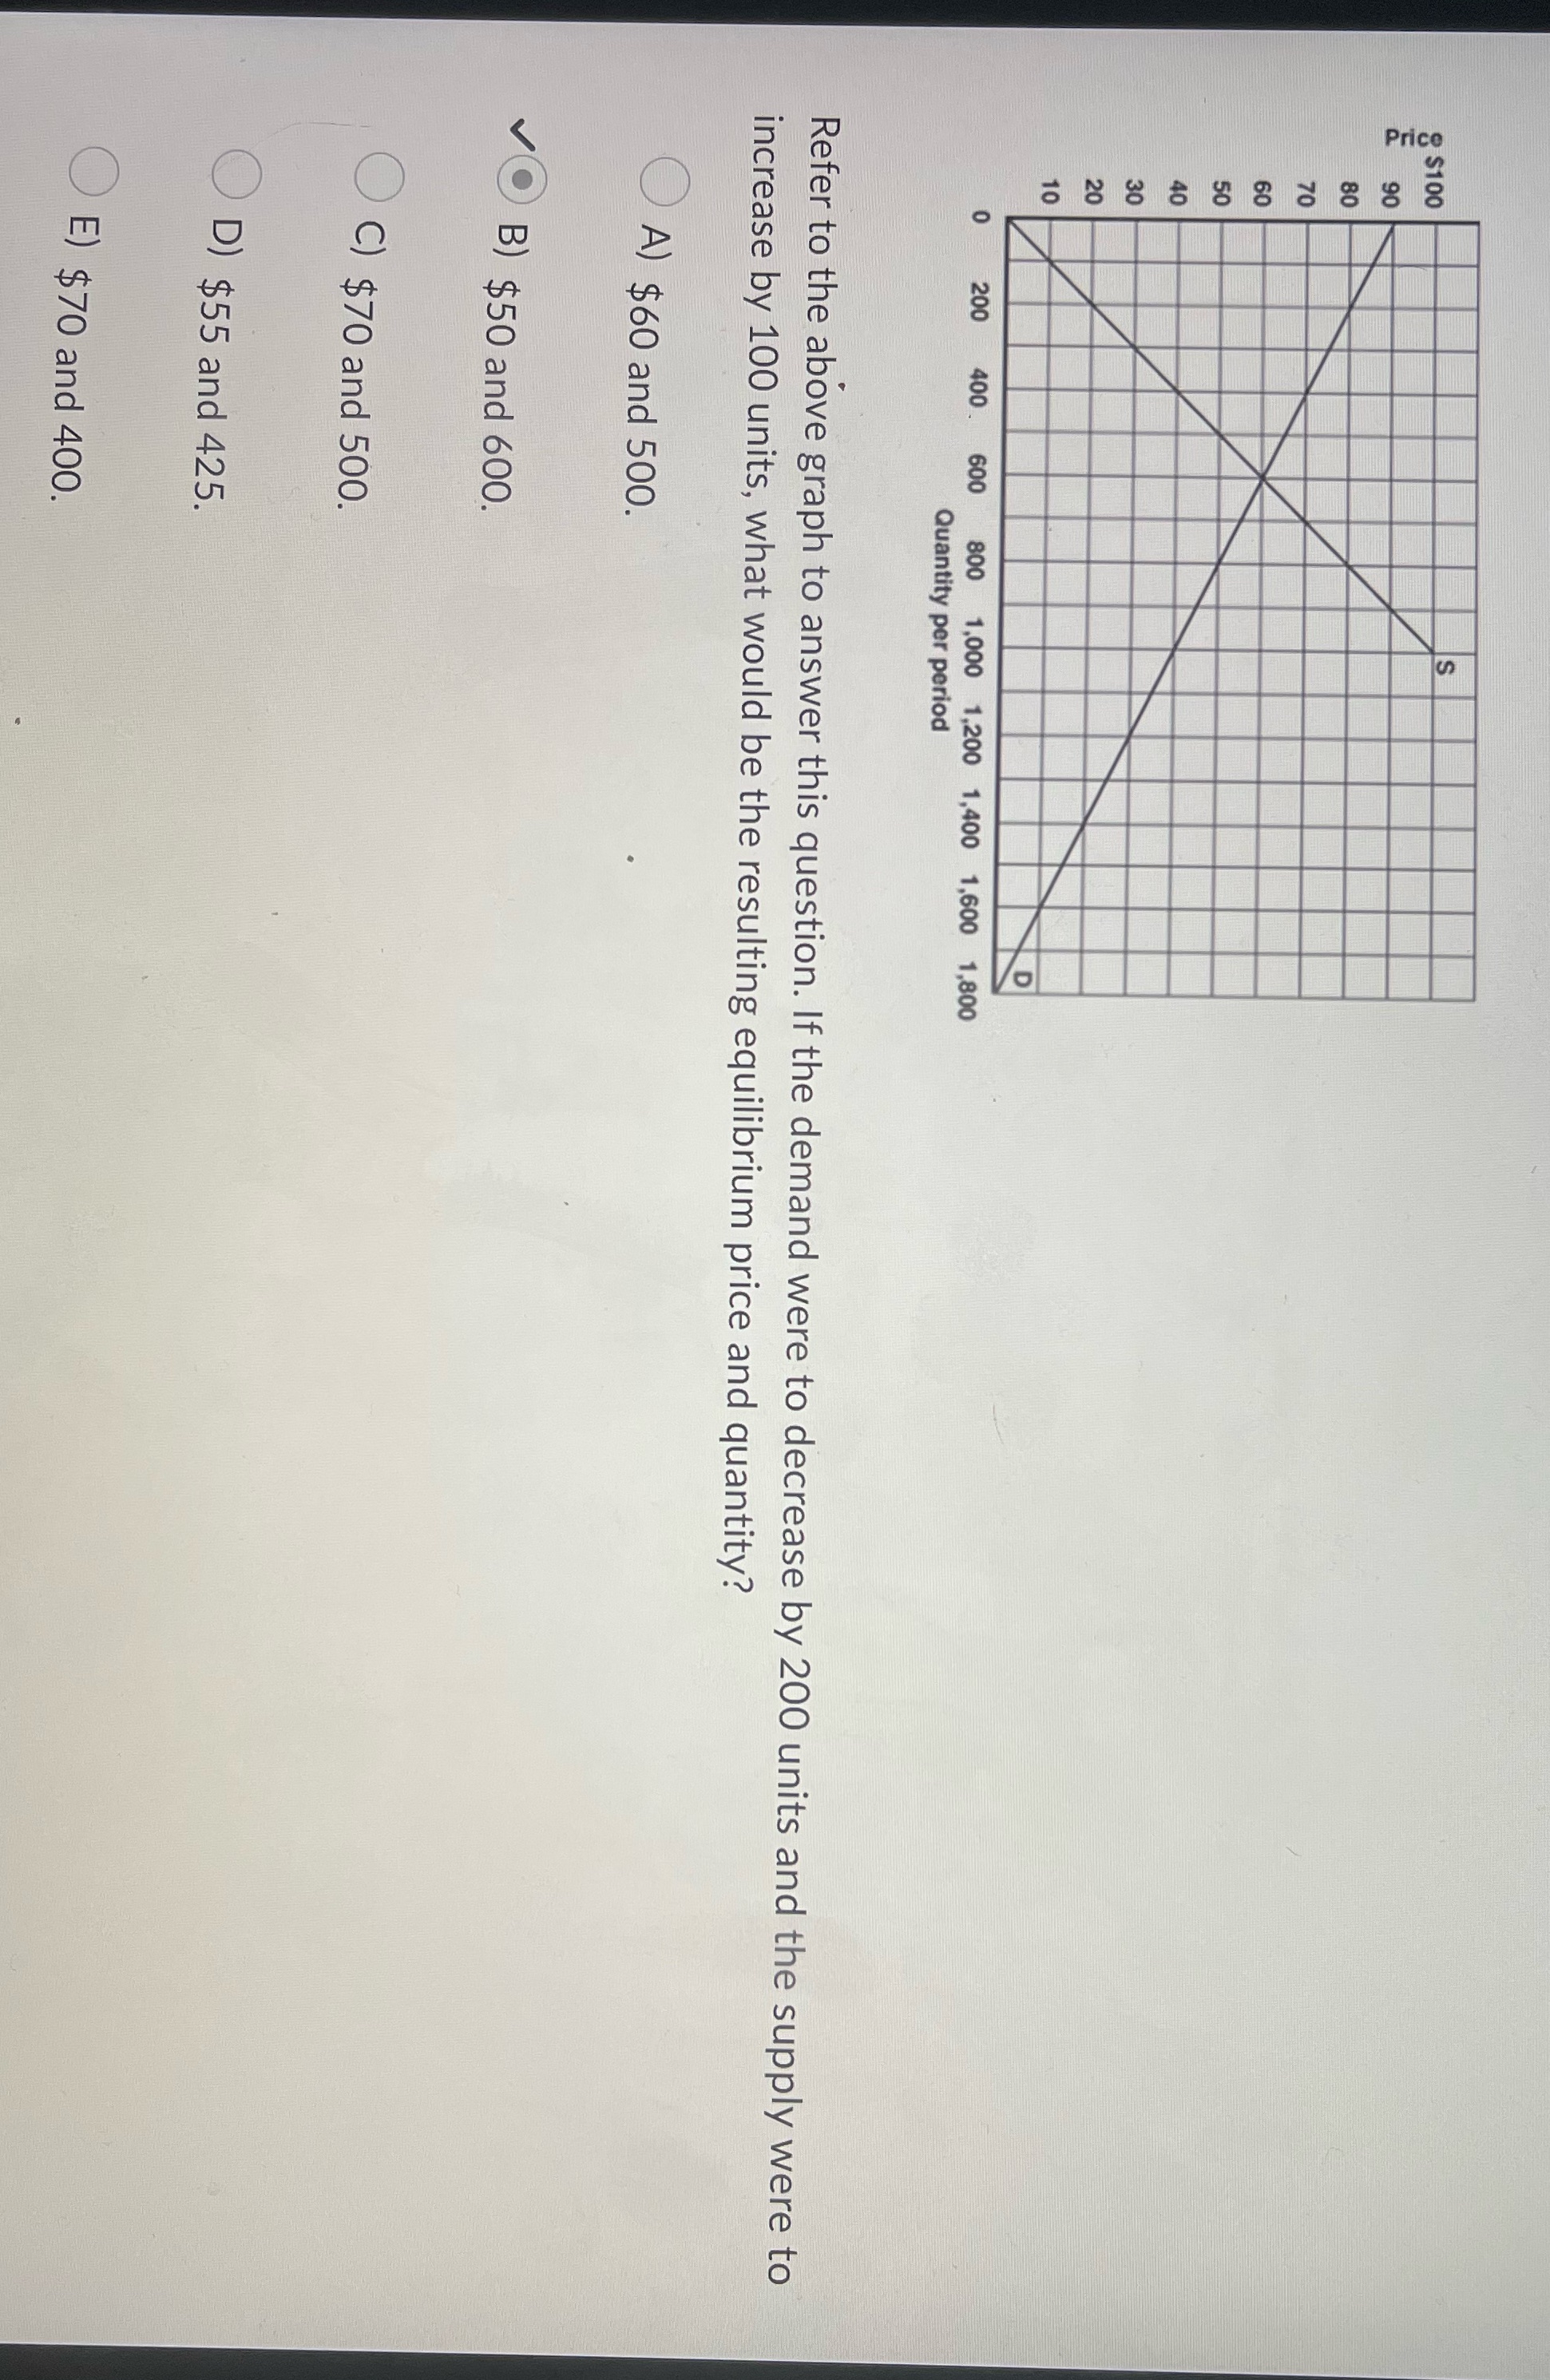
Price 8 8 8 2 8 8 9 8 8 9 200 400 600 800 1,000 1,200 1,400 1,600 1,800 O Quantity per period Refer to the above graph to answer this question. If the demand were to decrease by 200 units and the supply were to increase by 100 units, what would be the resulting equilibrium price and quantity? O A) $60 and 500. OB) $50 and 600. O C) $70 and 500. O D) $55 and 425. O E) $70 and 400
Step by Step Solution
There are 3 Steps involved in it
1 Expert Approved Answer
Step: 1 Unlock

Question Has Been Solved by an Expert!
Get step-by-step solutions from verified subject matter experts
Step: 2 Unlock
Step: 3 Unlock