

Question: Kindly solve precisely The weekly amount spent on childcare for one child is believed to depend on the age of the child. We denote by
Kindly solve precisely
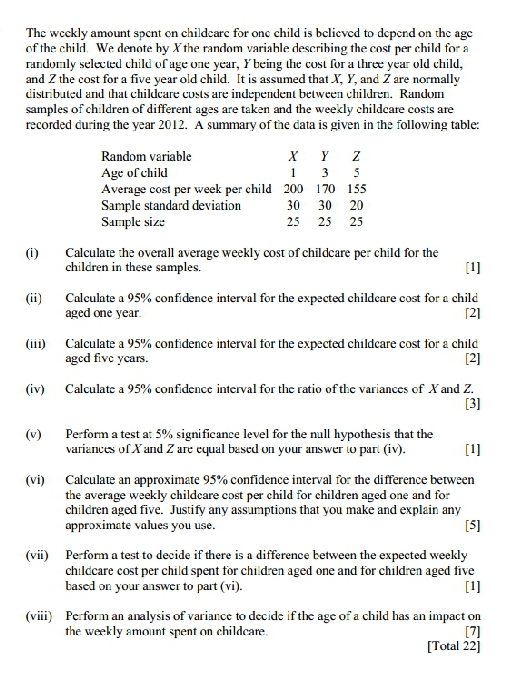
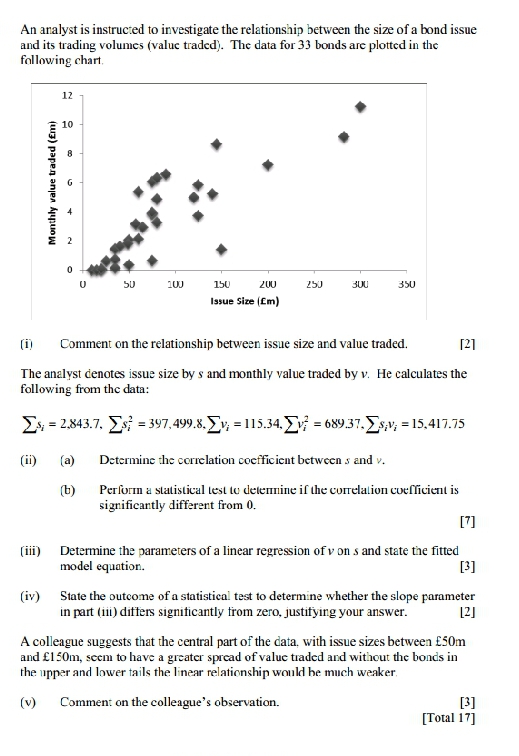
The weekly amount spent on childcare for one child is believed to depend on the age of the child. We denote by X the random variable describing the cost per child for a randomly selected child of age one year, Y being the cost for a three year old child. and Z the cost for a five year old child. It is assumed that X, Y, and 7 are normally distributed and that childcare costs are independent between children. Random samples of children of different ages are taken and the weekly childcare costs are recorded during the year 2012. A summary of the data is given in the following table: Random variable X Y Z Age of child 1 3 5 Average cost per week per child 200 170 155 Sample standard deviation 30 30 20 Sample size 25 25 25 (1) Calculate the overall average weekly cost of childcare per child for the children in these samples. [1] (ii) Calculate a 95% confidence interval for the expected childcare cost for a child aged one year. 121 (iii) Calculate a 95% confidence interval for the expected childcare cost for a child aged five years. [2] (iv) Calculate a 95% confidence interval for the ratio of the variances of X and Z. [3] (v) Perform a test at 5% significance level for the null hypothesis that the variances of X and Z are equal based on your answer to part (iv). [1] (vi) Calculate an approximate 95% confidence interval for the difference between the average weekly childcare cost per child for children aged one and for children aged five. Justify any assumptions that you make and explain any approximate values you use. [5] (vii) Perform a test to decide if there is a difference between the expected weekly childcare cost per child spent for children aged one and for children aged five based on your answer to part (vi). [1] (viii) Perform an analysis of variance to decide if the age of a child has an impact on the weekly amount spent on childcare. [7] [Total 22]An analyst is instructed to investigate the relationship between the size of a bond issue and its trading volumes (value traded). The data for 33 bonds are plotted in the following chart. 12 10 Monthly value traded (Em) G 10J 150 200 250 3UU 350 Issue Size (Em) [i) Comment on the relationship between issue size and value traded. 127 The analyst denotes issue size by s and monthly value traded by v. He calculates the following from the data: [s, = 2.843.7. (s = 397,499.8. _v; = 115.34. )v; = 689.37. )s,v; = 15.417.75 (a) Determine the correlation coefficient between s and v. (b) Perform a statistical test to determine if the correlation coefficient is significantly different from 0. [7] [iii) Determine the parameters of a linear regression of v on s and state the fitted model equation. [3] (iv) State the outcome of a statistical test to determine whether the slope parameter in part (iii) differs significantly from zero, justifying your answer. 12] A colleague suggests that the central part of the data, with issue sizes between $50m and f150m, seem to have a greater spread of value traded and without the bonds in the upper and lower tails the linear relationship would be much weaker. (v) Comment on the colleague's observation. [3] [Total 17]
Step by Step Solution
There are 3 Steps involved in it

Get step-by-step solutions from verified subject matter experts