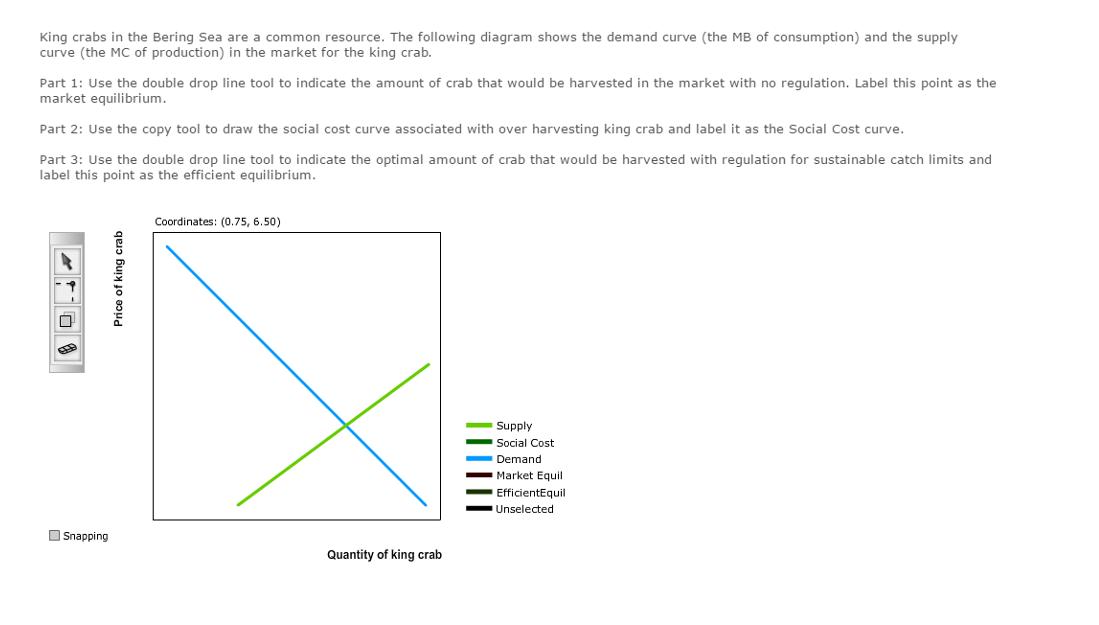
King crabs in the Bering Sea are a common resource. The following diagram shows the demand...
Fantastic news! We've Found the answer you've been seeking!
Question:
Transcribed Image Text:
King crabs in the Bering Sea are a common resource. The following diagram shows the demand curve (the MB of consumption) and the supply curve (the MC of production) in the market for the king crab. Part 1: Use the double drop line tool to indicate the amount of crab that would be harvested in the market with no regulation. Label this point as the market equilibrium. Part 2: Use the copy tool to draw the social cost curve associated with over harvesting king crab and label it as the Social Cost curve. Part 3: Use the double drop line tool to indicate the optimal amount of crab that would be harvested with regulation for sustainable catch limits and label this point as the efficient equilibrium. 71 Price of king crab Snapping Coordinates: (0.75, 6.50) Quantity of king crab Supply Social Cost Demand Market Equil EfficientEquil Unselected King crabs in the Bering Sea are a common resource. The following diagram shows the demand curve (the MB of consumption) and the supply curve (the MC of production) in the market for the king crab. Part 1: Use the double drop line tool to indicate the amount of crab that would be harvested in the market with no regulation. Label this point as the market equilibrium. Part 2: Use the copy tool to draw the social cost curve associated with over harvesting king crab and label it as the Social Cost curve. Part 3: Use the double drop line tool to indicate the optimal amount of crab that would be harvested with regulation for sustainable catch limits and label this point as the efficient equilibrium. 71 Price of king crab Snapping Coordinates: (0.75, 6.50) Quantity of king crab Supply Social Cost Demand Market Equil EfficientEquil Unselected
Expert Answer:
Answer rating: 100% (QA)
Below graph shows the demand supply and social cost curve of King crab Price o... View the full answer
Related Book For
Business Statistics For Contemporary Decision Making
ISBN: 978-1118749647
8th edition
Authors: Black Ken
Posted Date:
Students also viewed these accounting questions
-
Use the line drawing tool to draw the demand curve for coffee at your neighborhood coffee shop, and then label it as Demand 1. Suppose your neighborhood coffee shop implements a new program that...
-
The following diagram shows the market demand and market supply for sweaters. Calculate consumer surplus, producer surplus, and social surplus in this market. Supply 90 60 20 Demand 100 Quantity
-
Draw a standard supply and demand diagram for widgets, and indicate the equilibrium price and output. a. Assuming that the production of widgets generates external costs, illustrate the effect of the...
-
Cedric has the demand function, namely q = 0.02m - 2p, where m is income and p is price. Cedrics initial income is $6,000 and he initially had to pay a price of $40 per bottle of claret. The price of...
-
For the linear program Min6A + 4B s.t. 2A + 1B 12 1A + 1B 10 1B 4 A, B 0 a. Write the problem in standard form. b. Solve the problem using the graphical solution procedure. c. What are the values...
-
Briefly explain the differences between periodic and perpetual inventory systems. Under what general circumstances is each used?
-
Which operations have the same precedence in order of operations?
-
Logan Fruit Drink Company planned to make 200,000 containers of apple juice. It expected to use two cups of frozen apple concentrate to make each container of juice, thus using 400,000 cups of frozen...
-
Liabilities and Equity A C D Another Subgroup Balance Sheet Long-term A 0.59 0.47 Percentages Mobi/capitalization 0.27 0.06 0.33 0.28 0.14 0.57 0.62 0.18 With services, we identified a group of...
-
The company has made the following profit-sharing contributions to the retirement plan for Archie and Elaine for each of the related years. 2021 2020 2019 2018 2017 2016 Balance 1/1/16 Archie None...
-
W P2.7-12 (a) Configuration of rubber load-transfer pads.
-
1.) Discuss actions that you found through the reading and your research that managers can take to motivate their employees. 2.) Identify actions that managers can take to improve employee...
-
Explain the concept of income distribution and discuss different theories and policies aimed at reducing income inequality.
-
explain the various leaadership styles and discuss their silent features. which leadership style is best and why?
-
Job Satisfaction - discuss the level of job satisfaction experienced by employees.
-
Consider the relationship between service levels and cost. Then discuss how the typical customer service objectives and levels of performance in each objective will affect the cost of serving the...
-
Which lines of the following story demonstrate Woofitt's fact-construction criteria for reporting paranormal events? Types of criteria include 1) sequential organization of discourse, 2) X/Y format,...
-
Graph the following conic sections, labeling vertices, foci, directrices, and asymptotes (if they exist). Give the eccentricity of the curve. Use a graphing utility to check your work. 10 5 + 2 cos 0
-
A business convention holds its registration on Wednesday morning from 9:00 A.M. until 12:00 noon. Past history has shown that registrant arrivals follow a Poisson distribution at an average rate of...
-
A customer relations expert for a retail tire company is interested in determining if there is any relationship between a customers level of education and his or her rating of the quality of the tire...
-
Study the Excel regression output that follows. How many predictors are there? What is the equation of the regression model? Using the key statistics discussed in this chapter, discuss the strength...
-
Modify the predictor-corrector formulas (10.27)-(10.30) for the method that uses the second-order Adams-Bashforth time-integration scheme (see Section 7.4.1) instead of the simple explicit scheme.
-
Compare the four algorithms described in Section 10.4 (SIMPLE, SIMPLER, SIMPLEC, PISO) by the amount of computations required for one iteration. Does the smaller amount necessarily mean smaller time...
-
Develop the formula (10.43) for the case of the \(x\)-momentum equation of a two-dimensional steady-state incompressible flow discretized on a structured uniform finite difference grid. Use central...
Study smarter with the SolutionInn App