

Question: Kiwi Analytics is assessing two different training programs for its consulting employees. One group of 50 employees used training method A for varying numbers of
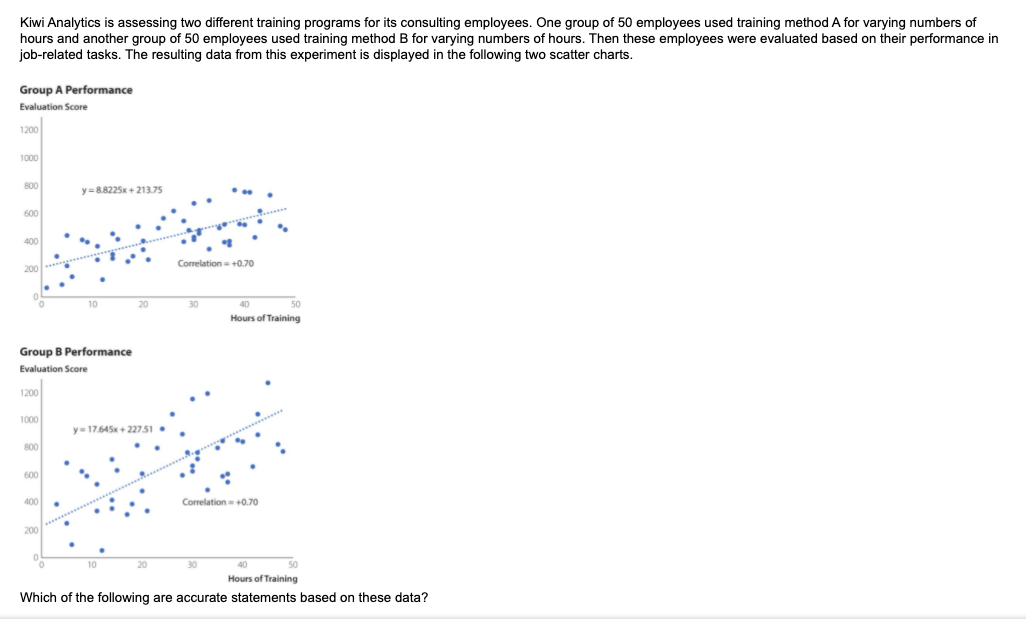


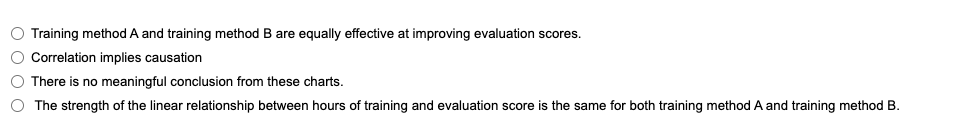
Kiwi Analytics is assessing two different training programs for its consulting employees. One group of 50 employees used training method A for varying numbers of hours and another group of 50 employees used training method B for varying numbers of hours. Then these employees were evaluated based on their performance in job-related tasks. The resulting data from this experiment is displayed in the following two scatter charts. Group A Performance Evaluation Score 1200 1000 BOC y = 8.8225x + 213.75 500 Comelation = +0.70 10 20 30 40 50 Hours of Training Group B Performance Evaluation Score 1200 1000 y = 17.645x + 227.51 . BOO 400 Correlation = +0.70 200 10 20 30 40 Hours of Training Which of the following are accurate statements based on these data?O Training method A and training method B are equally effective at improving evaluation scores. O Correlation implies causation There is no meaningful conclusion from these charts. O The strength of the linear relationship between hours of training and evaluation score is the same for both training method A and training method B
Step by Step Solution
There are 3 Steps involved in it

Get step-by-step solutions from verified subject matter experts