

Question: KNOWLEDGE CHECK 221 Here is a chart displaying estimates of the initial jobless claims indicator, one of the main unemployment statistics in the U.S. It
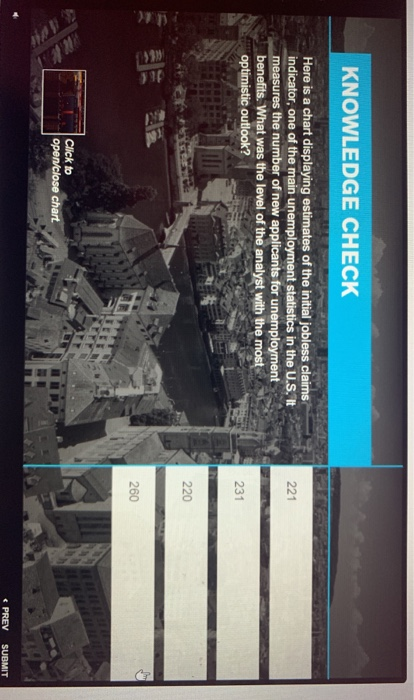
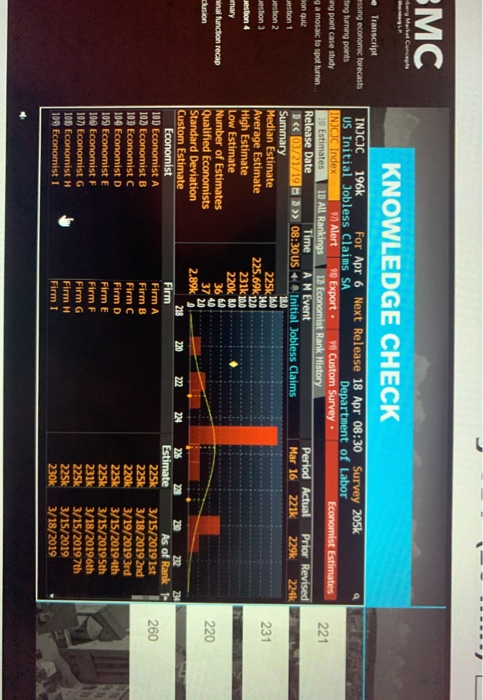
KNOWLEDGE CHECK 221 Here is a chart displaying estimates of the initial jobless claims indicator, one of the main unemployment statistics in the U.S. It measures the number of new applicants for unemployment benefits. What was the level of the analyst with the most optimistic outlook? 231 220 260 Click to open/close chart. > 08:30 US 4 Initial Jobless Claims Mar 16 221k 229k 224k Summary 18.0 Median Estimate 16.0 Average Estimate High Estimate 231k 100 Low Estimate 220k 80 Number of Estimates Qualified Economists 37 20 Standard Deviation Custom Estimate 213 220 224 26 228 220 22 230 Economist Firm Estimate As of Rank 101 Economist A Firm A 225k 3/15/2019 1st 107 Economist B Firm B 225k 3/18/2019 2nd 103) Economist C Firm C 220k 3/19/2019 3rd 104 Economist D Firm D 225k 3/15/2019 4th 105) Economist E Firm E 225k 3/15/2019 Sth 100 Economist F Firm F 231k 3/18/20196th 107) Economist G Firm G 225k 3/15/2019 7th 108 Economist H Firm H 225k 3/15/2019 109) Economist I Firm I 230k 3/18/2019 36 4 anal function recap clusion 220 2.89 260
Step by Step Solution
There are 3 Steps involved in it

Get step-by-step solutions from verified subject matter experts