

Question: KNOWLEDGE CHECK The below image captures the VaR on May 20, 2019. What percentage of your portfolio could you lose on average if the next
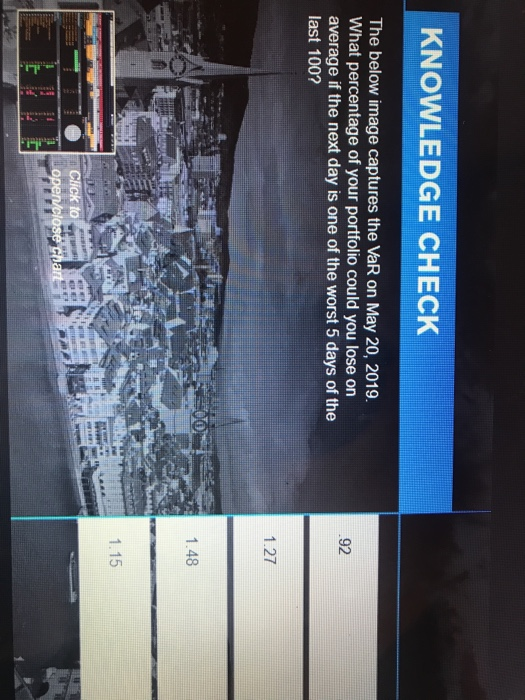
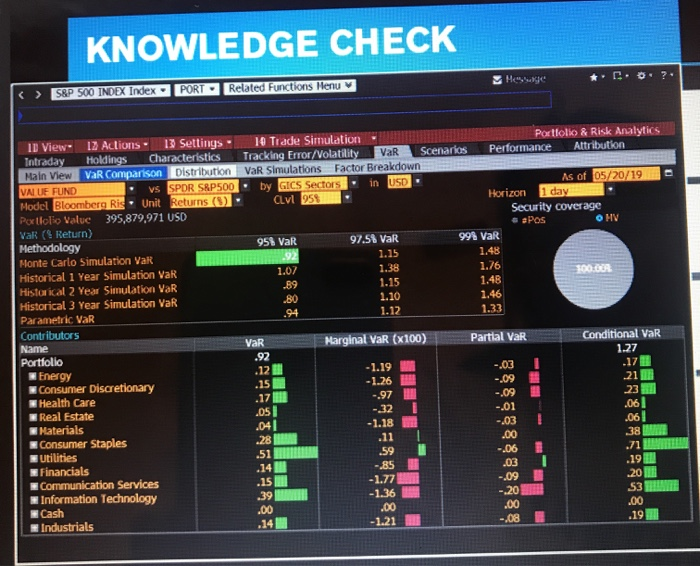
KNOWLEDGE CHECK The below image captures the VaR on May 20, 2019. What percentage of your portfolio could you lose on average if the next day is one of the worst 5 days of the last 100? 1.27 1.48 1.15 1 Click to open/close chart KNOWLEDGE CHECK S&P 500 INDEX Index PORT Related Functions Menu MS .89 10 View 12 Actions Settings 10 Trade Simulation Portfolio & Risk Analytics Intraday Holdings Characteristics Tracking Error/Volatility VaR Scenarios Performance Attribution Main View VaR Comparison Distribution VaR Simulations Factor Breakdown VAI UF FUND vs SPDR SRP500. by GICS Sectors in USD. As of 05/20/19 Model Bloomberg Ris. Unit Returns (3) Clvl 958 Horizon 1 day Policlio Value 395,879,971 USD Security coverage VaR (Return) &apos OMV Methodology 951 VaR 97.54 VaR 99% VaR Monte Carlo Simulation Var .92 1.15 1.48 Historical 1 Year Simulation VaR 1.07 1.38 1.76 Historical 2 Year Simulation VaR 1.15 1.48 Historical 3 Year Simulation VaR 1.10 1.46 Parametric VaR .94 1.12 1.33 Contributors Name Marginal VaR (x100) Partial Var Conditional VaR Portfolio .92 1.27 Energy -1.19 .17 Consumer Discretionary -1.26 Health Care 23 Real Estate .051 -.01 Materials -.03 .06 Consumer Staples 38 Utilities -.06 21 Financials .03 .29 Communication Services 72 -.09 Information Technology - 20 Cash ,00 Industrials 1.21 ,08 .19 VaR .12 .15 21 ,061 .041 -1.18 .00 .15 20 53 .00 PC
Step by Step Solution
There are 3 Steps involved in it

Get step-by-step solutions from verified subject matter experts