

Question: KNOWLEDGE CHECK Transcript Which of the graphs most clearly represents investors predicting a downturn in the economy? A your movem B mon dom Click to
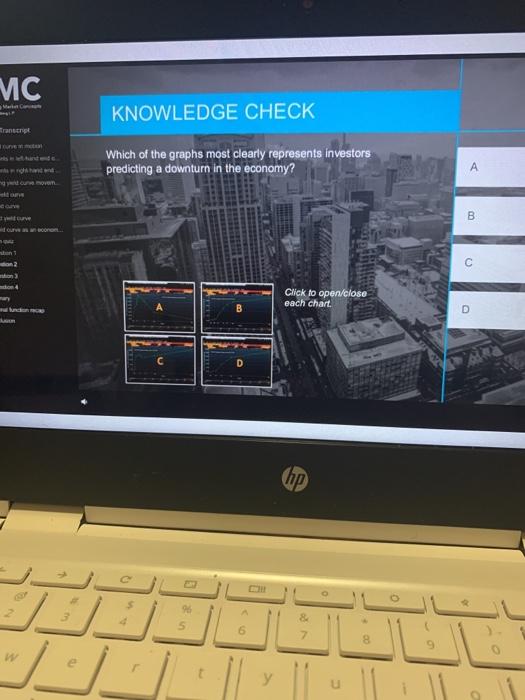
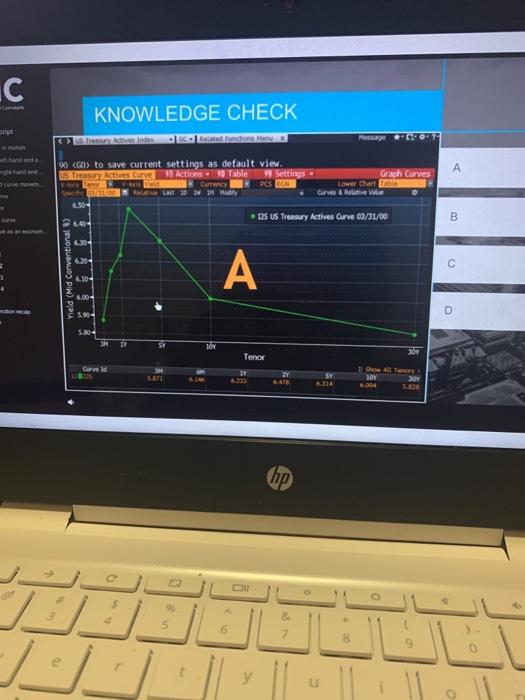
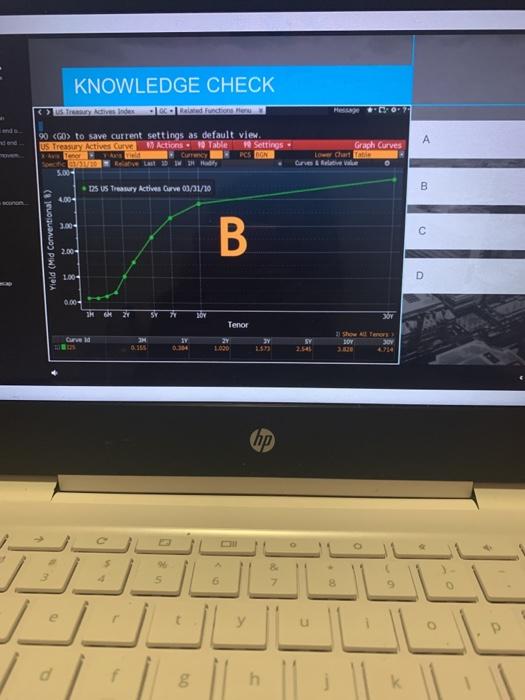
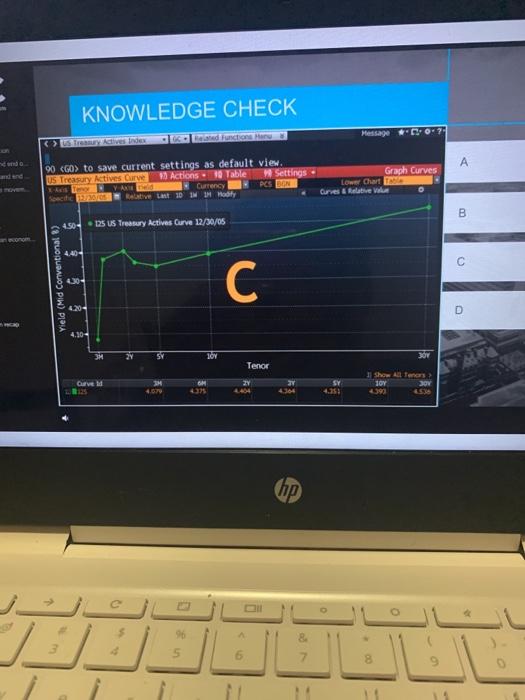
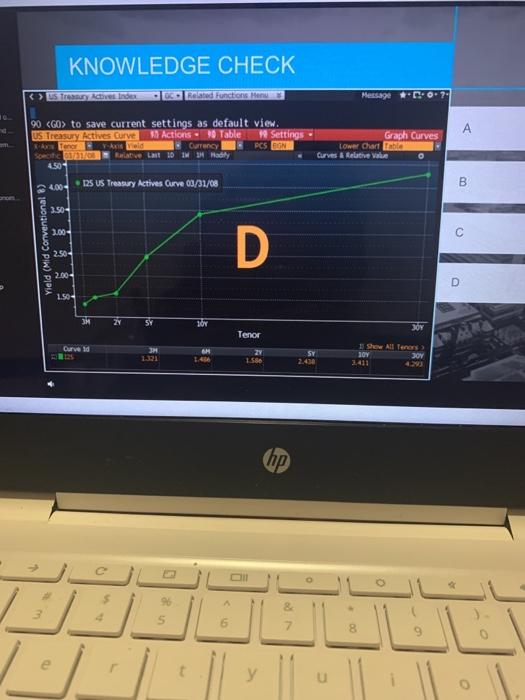
KNOWLEDGE CHECK Transcript Which of the graphs most clearly represents investors predicting a downturn in the economy? A your movem B mon dom Click to open/close each chart. B D D hp > B 5 6 w C KNOWLEDGE CHECK ad function Message Oo7 ript con chander 90 Go to save current settings as default view. ES Try Curve Action Table Settings Graph Curves CTCY lower Carta Toe 1M Curve & Relative ale 4.50 s US Treasury Active Curve 03/31/00 64 B 6304 Yield (Mid Conventional) 6.10 5.804 SOY Tenor 17 ST 16 1 Show All Toner 10 02 0.004 SEE hp c . 4 5 8 KNOWLEDGE CHECK Rue * * * A 90 Go to save current settings as default view. US Treasury Active Care Action Table Settings Cart PCS RON Graph Curves Low Chart r1fr 5.00 BB5 16 1story acties Go 03/31/10 B 4.00 3.004 Yield (Mid Conventional) B C 2.00 100- D 0.004 Tenor 1 H 0.155 BOY 1.020 (hp ___ y d h KNOWLEDGE CHECK Message 007 do A 90 to save current settings as default view. US Treasury Retives Clarve Actions Table Settings Currency PCS DON Relative Last 10 MM Madly Graph Curves Low Chart Curves Relative a B 450 25 US Treasury Active Curve 12/30/05 4.40 Yield (Mid Conventional) 30- . 4.20 D 4.30 3M SY TOY Tenor Curved 3125 Show All tenen 10 V 390 4. 4464 4364 4.95 (hp c 96 KNOWLEDGE CHECK US Trend Red Functions en Message 0:0.7 A 90 to save current settings as default view. US Treasury Actives Curve Actions - 90 Table Settings W tener vo Currency PCS BEN Socio Relative Last 10 Hadity 450 Graph Curves Love Chart Etable Curves & Relative Value B RS US Treasury Actives Curve 03/31/08 4.00 3.504 3.00 Yield (Mid Conventional 8) D 2.56 2.00 1.50 3H TOY 30 Tenor Ourved 1 Show All Tenen 10Y 30V 2Y 1588 1321 2.00 hp c 96 3 4 6
Step by Step Solution
There are 3 Steps involved in it
To determine which graph represents investors predicting a dow... View full answer

Get step-by-step solutions from verified subject matter experts