

Question: l Table 2: Financial Results Pok A B D Selected Financial and Operating Statistics Corts and Proma Percent of Net Revenue Cost of Whee Miting
l 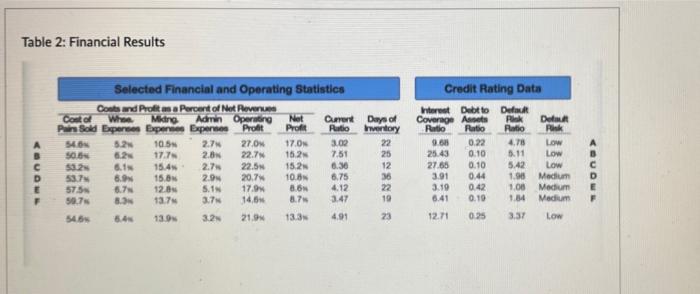
Table 2: Financial Results Pok A B D Selected Financial and Operating Statistics Corts and Proma Percent of Net Revenue Cost of Whee Miting Admin Operating Net Omer Days of Pa Sold Experies Expenses Experten Profit Profit Ratio hrwertory 540 5.2 10.5 27 27.0 17.0 3.02 22 50. 6.2 177 2.0 22.7 15.2 7.51 25 6.1 15.45 2.7 22.5 15.2 6.30 12 8. 15.0N 2.0 20.7 10.0 6.75 36 575 6.71 12.0 S.IN 17.9 8.6 4.12 22 50.7 8. 13.7 3.7 14. 17 3.47 19 546 13.0 32 21.9 13.3 4.91 23 Credit Rating Data Interest Debt to De Coverage Arts Rik De Ratio Ratio Ratio 9.68 0.22 4.78 Low 25.43 0.10 5.11 Low 27.65 0.10 5.42 Low 0.44 1.00 Medium 3.10 0.42 1.08 Medium 8.41 0.10 1.84 Medium 12.71 0.25 3.37 Low 3.91 B c D E F Identify the two (2) Key Financial and Operating statistics impacting Company F's performance in Table 2. Edit View Insert Format Tools Table 12ptParagraph U Av evry oo. : Which company is the industry leader for the results in Table 2? OB OD OF In Table 2, how does Company F compare to the most important Financial and Operating Statistics and Credit Rating Data of the industry leader? List three (3) statistics. Edit View Insert Format Tools Table 12pt Paragraph BIU AR TO Step by Step Solution
There are 3 Steps involved in it
1 Expert Approved Answer
Step: 1 Unlock

Question Has Been Solved by an Expert!
Get step-by-step solutions from verified subject matter experts
Step: 2 Unlock
Step: 3 Unlock