

Question: l. The data below were gathered on a random sample of5 basking sharks, swimming through the water and lter-feeding, i.e., letting the water bring food

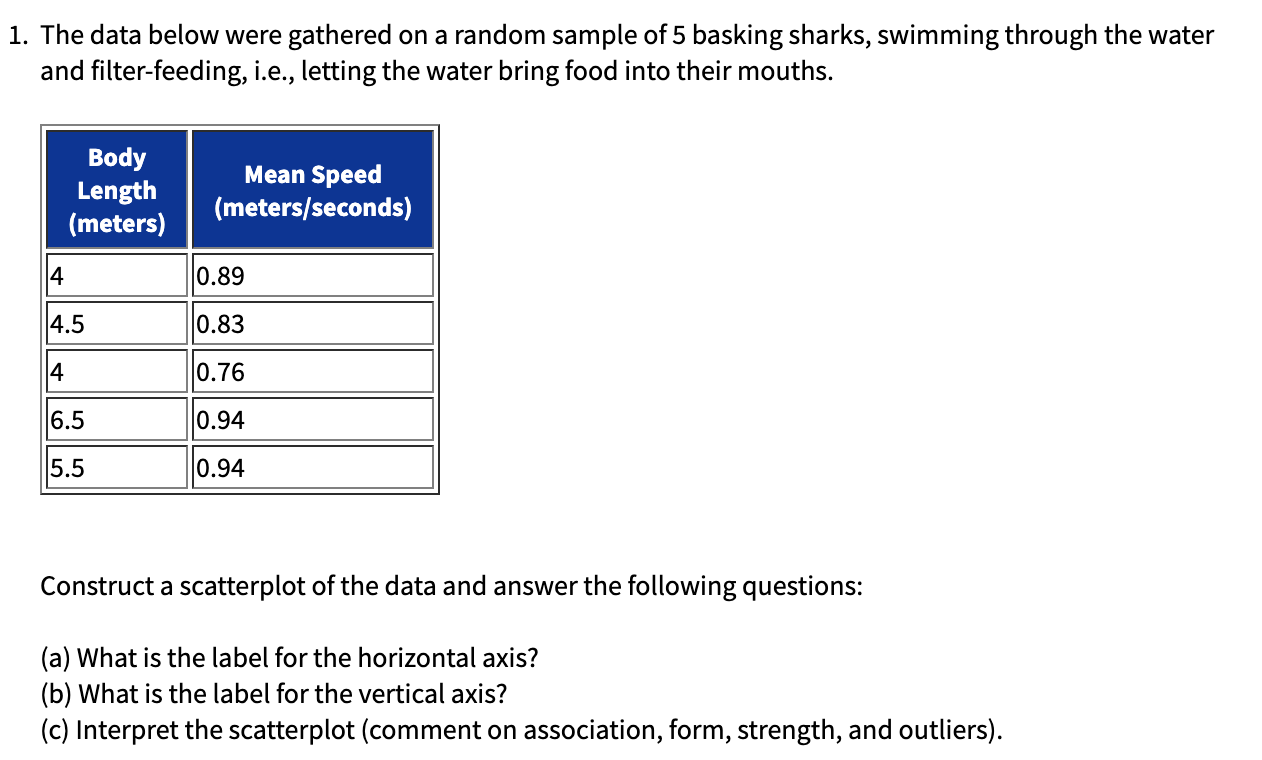
l. The data below were gathered on a random sample of5 basking sharks, swimming through the water and lter-feeding, i.e., letting the water bring food into their mouths. Body Length (meters) MeanSpeed (mete rs/seconds] Construct a scatterplot of the data and answer the following questions: (a) What is the label for the horizontal axis? (b) What is the label for the vertical axis? (c) Interpret the scatterplot (comment on association, form, strength, and outliers)
Step by Step Solution
There are 3 Steps involved in it
1 Expert Approved Answer
Step: 1 Unlock

Question Has Been Solved by an Expert!
Get step-by-step solutions from verified subject matter experts
Step: 2 Unlock
Step: 3 Unlock