

Question: L0 1.1: I can apply, and interpret functions numerically, graphically, and algebraically. The graph represents the value (in dollars) of a certain stock over a

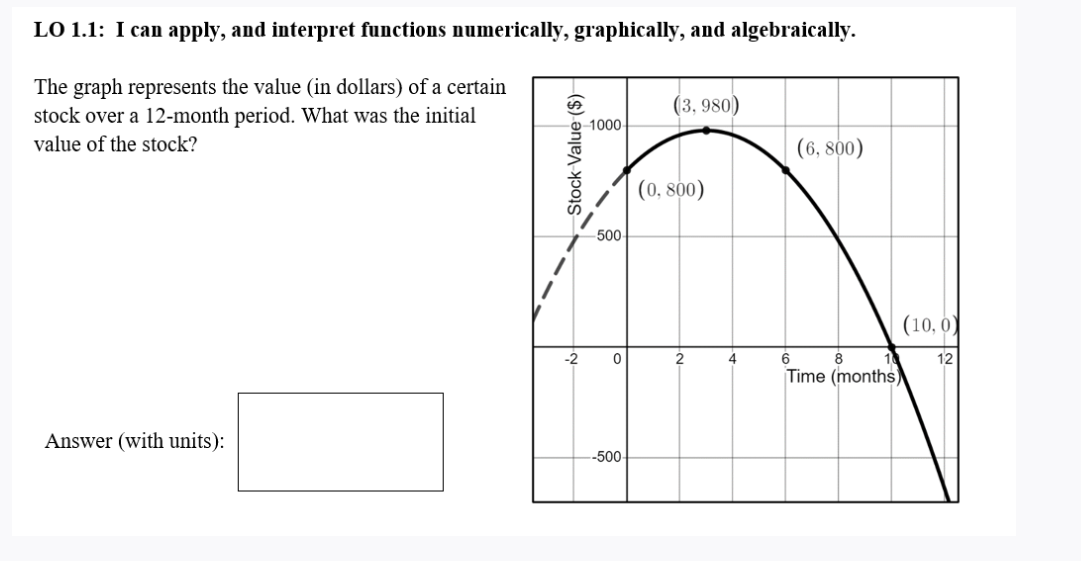
L0 1.1: I can apply, and interpret functions numerically, graphically, and algebraically. The graph represents the value (in dollars) of a certain stock over a 12-month period. What was the initial value of the stock? Answer (with units)
Step by Step Solution
There are 3 Steps involved in it
1 Expert Approved Answer
Step: 1 Unlock

Question Has Been Solved by an Expert!
Get step-by-step solutions from verified subject matter experts
Step: 2 Unlock
Step: 3 Unlock