

Question: l1able Z. Discharge Data and Graph 1,000 800 | 600 | 4 | a ANNUAL PEAK DISCHARGE [m /sec) ) 100 80 &) 40 |
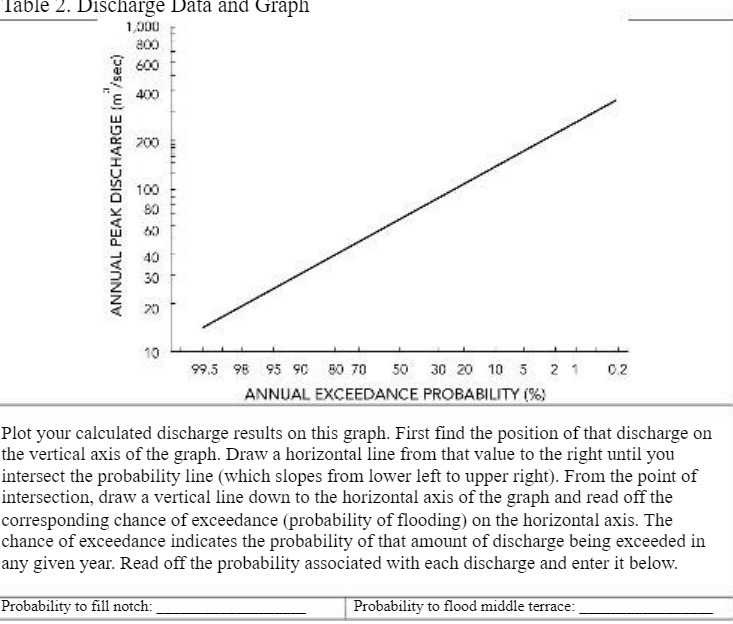
l1able Z. Discharge Data and Graph 1,000 800 | 600 | 4 | a ANNUAL PEAK DISCHARGE [m /sec) ) 100 80 &) 40 | AN T 4 T TN 7 T 10 95 98 9% BO0 S0 IV A2 10 5 2 1 c2 ANNUAL EXCEEDANCE PROBABILITY (% Plot your calculated discharge results on this graph. First find the position of that discharge on the vertical axis of the graph. Draw a horizontal line from that value to the right until you intersect the probability line (which slopes from lower left to upper right). From the point of intersection, draw a vertical line down to the horizontal axis of the graph and read off the corresponding chance of exceedance (probability of flooding) on the horizontal axis. The chance of exceedance indicates the probability of that amount of discharge being exceeded in any given year. Read off the probability associated with each discharge and enter it below. Probability to fill notch: Probability to flood middle terrace
Step by Step Solution
There are 3 Steps involved in it

Get step-by-step solutions from verified subject matter experts