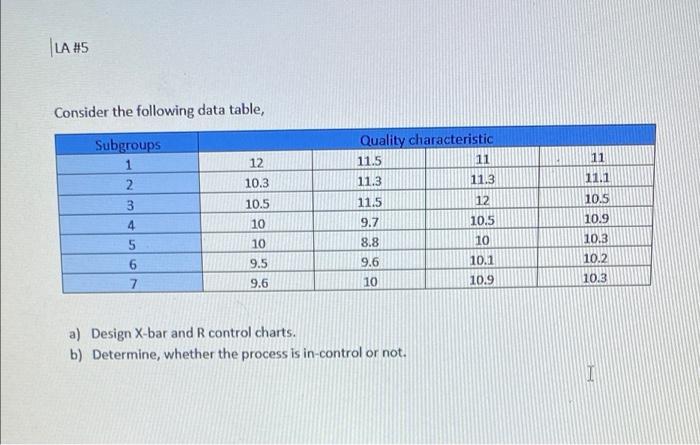
Question: LA #5 Consider the following data table, 11 12 Subgroups 1 2 3 Quality characteristic 11.5 11 11.3 11.3 11.1 10.3 11.5 12 10.5 10.5

LA #5 Consider the following data table, 11 12
LA #5 Consider the following data table, 11 12 Subgroups 1 2 3 Quality characteristic 11.5 11 11.3 11.3 11.1 10.3 11.5 12 10.5 10.5 10 9.7 10.5 10.9 4 5 10 10 10.3 10.2 6 8.8 9.6 10 9.5 10.1 7 9.6 10.9 10.3 a) Design X-bar and R control charts. b) Determine, whether the process is in-control or not

Step by Step Solution

There are 3 Steps involved in it

1 Expert Approved Answer
Step: 1 Unlock blur-text-image
Question Has Been Solved by an Expert!

Get step-by-step solutions from verified subject matter experts

Step: 2 Unlock
Step: 3 Unlock

Students Have Also Explored These Related General Management Questions!