

Question: la. Given the parabola below, f(t), has the following cartesian coordinates, determine an expression for a parabolic train, p(t), using the unit step function
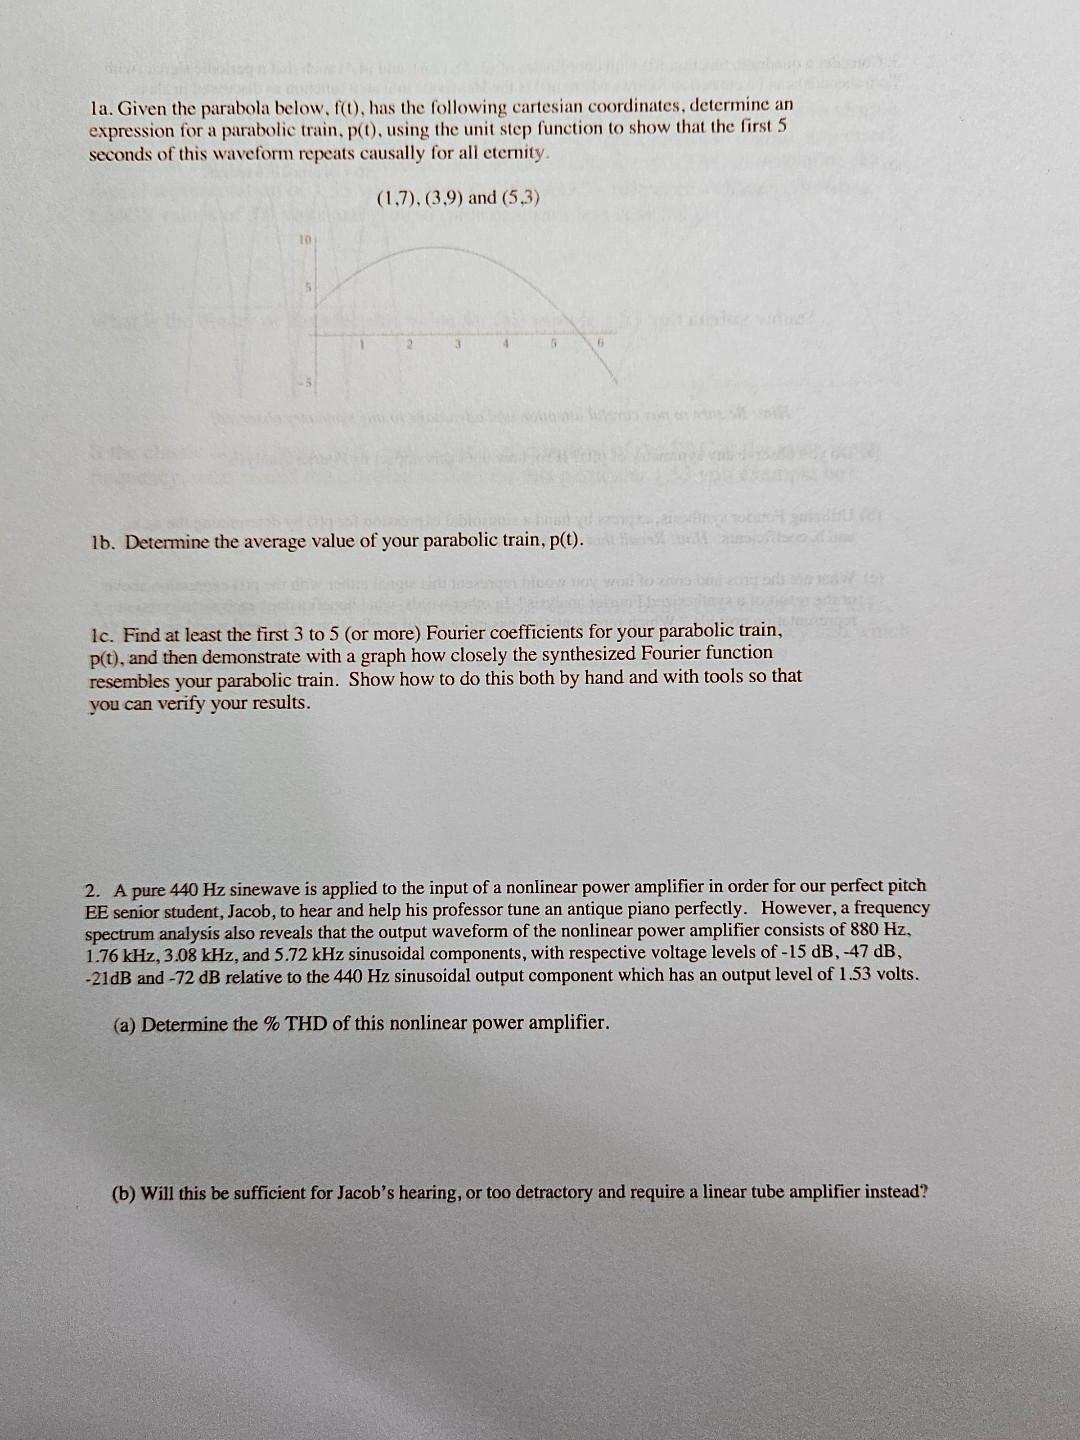
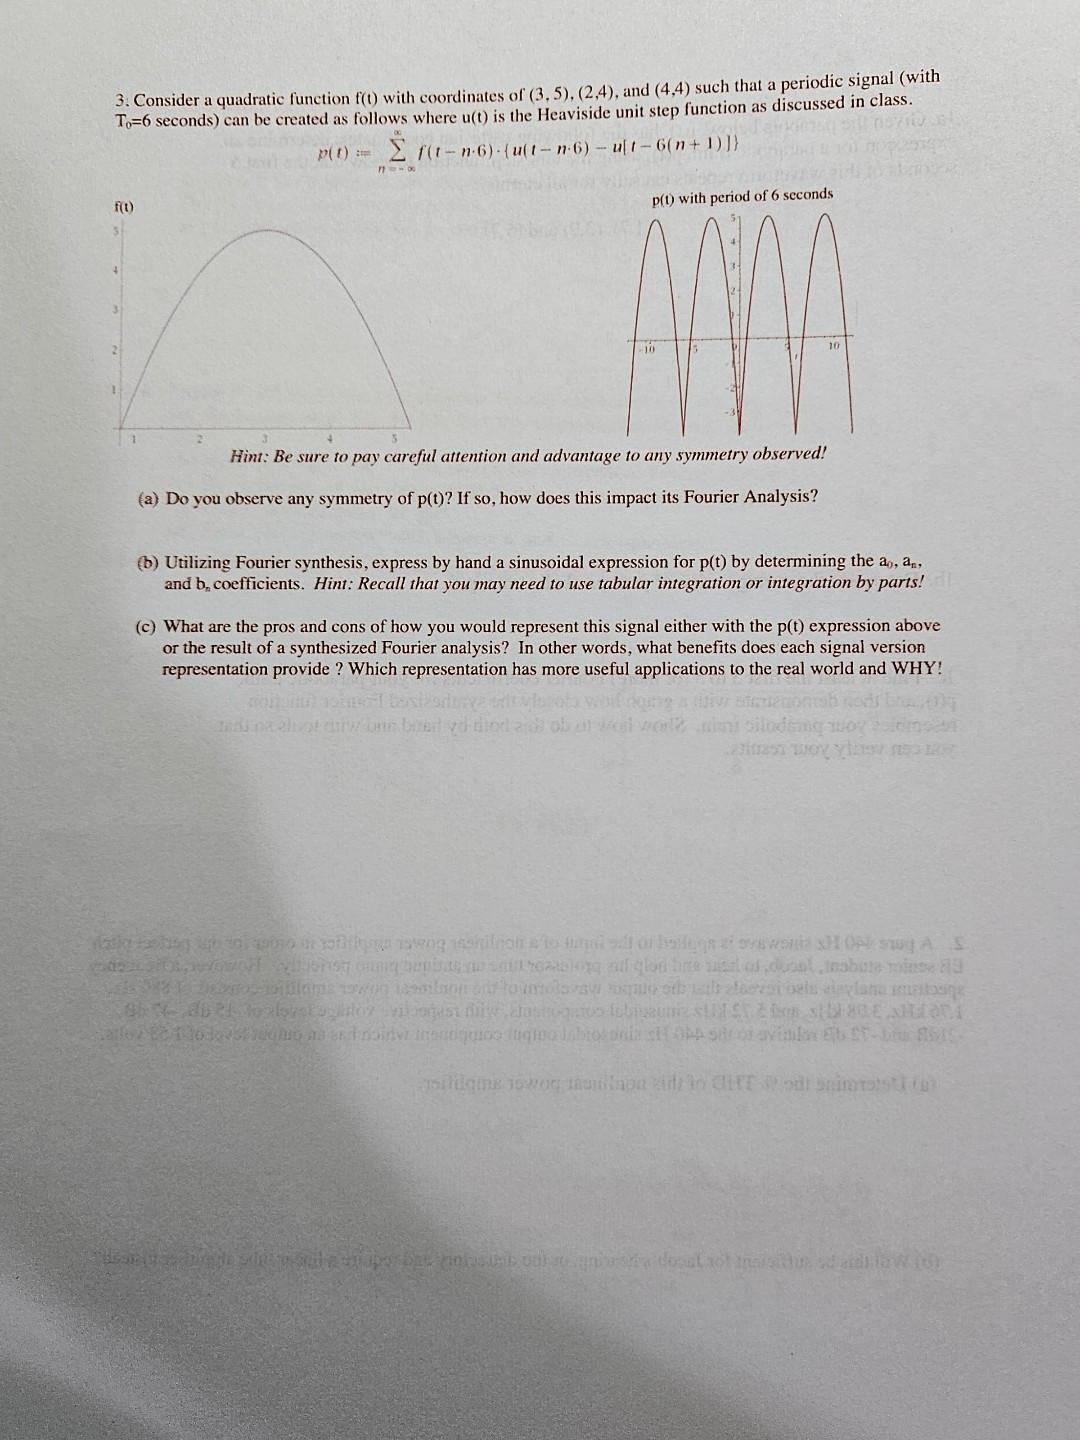
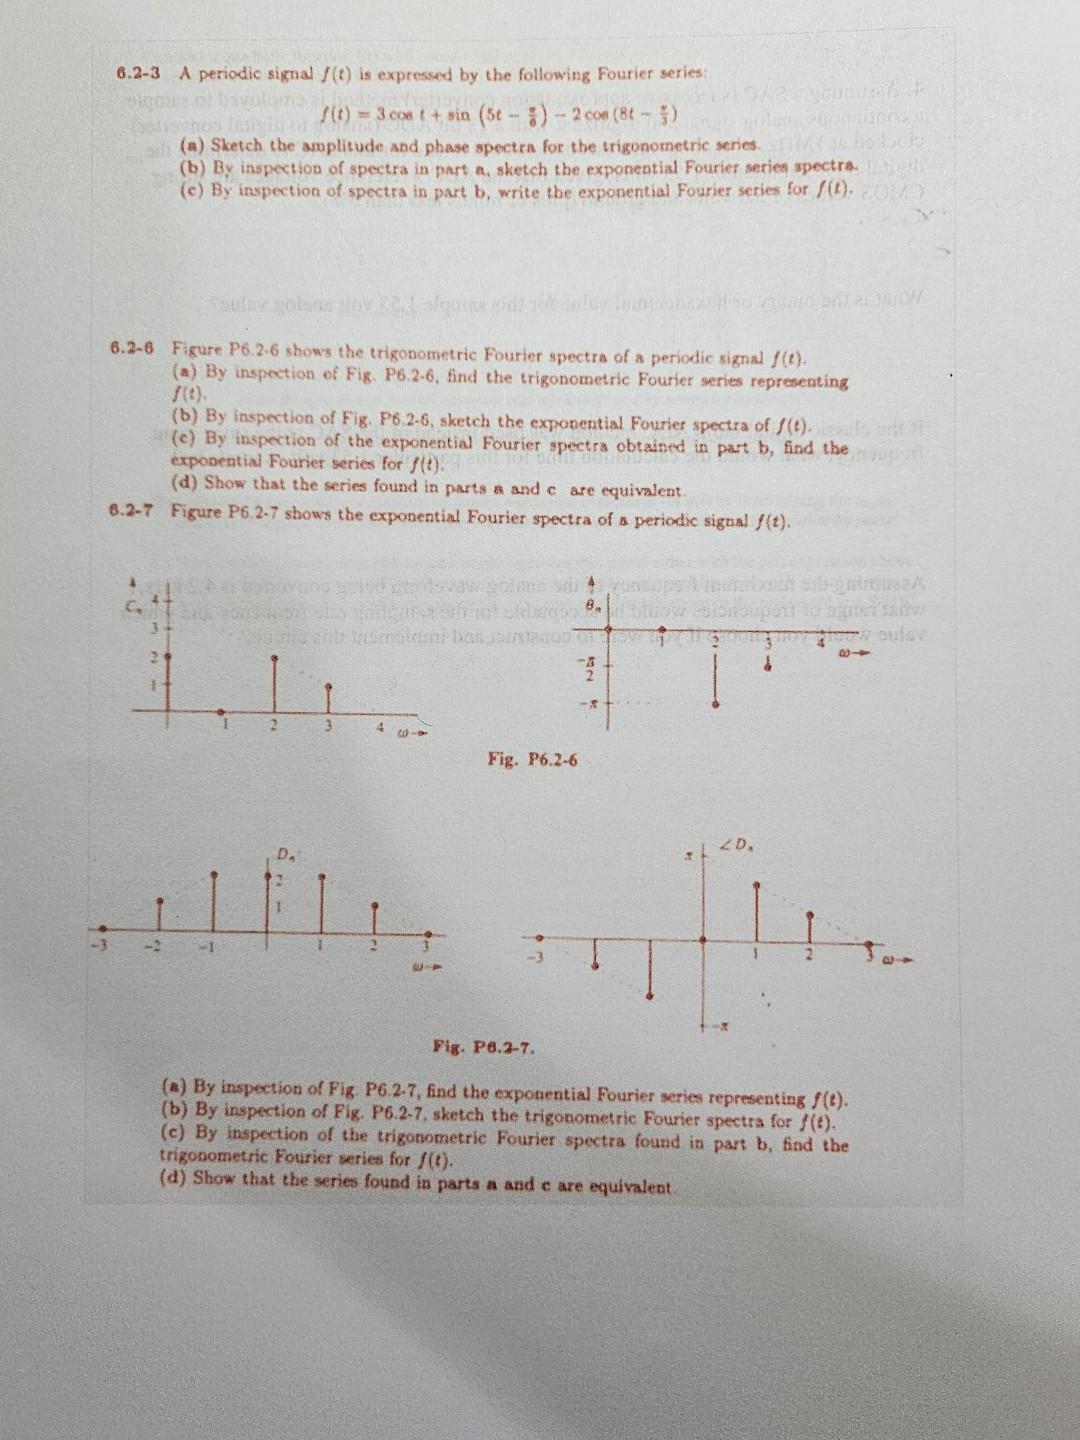
la. Given the parabola below, f(t), has the following cartesian coordinates, determine an expression for a parabolic train, p(t), using the unit step function to show that the first 5 seconds of this waveform repeats causally for all eternity. (1,7), (3,9) and (5.3) bloganies branqu lb. Determine the average value of your parabolic train, p(t). 6 1c. Find at least the first 3 to 5 (or more) Fourier coefficients for your parabolic train, p(t), and then demonstrate with a graph how closely the synthesized Fourier function resembles your parabolic train. Show how to do this both by hand and with tools so that you can verify your results. 2. A pure 440 Hz sinewave is applied to the input of a nonlinear power amplifier in order for our perfect pitch EE senior student, Jacob, to hear and help his professor tune an antique piano perfectly. However, a frequency spectrum analysis also reveals that the output waveform of the nonlinear power amplifier consists of 880 Hz, 1.76 kHz, 3.08 kHz, and 5.72 kHz sinusoidal components, with respective voltage levels of -15 dB, -47 dB, -21dB and -72 dB relative to the 440 Hz sinusoidal output component which has an output level of 1.53 volts. (a) Determine the % THD of this nonlinear power amplifier. (b) Will this be sufficient for Jacob's hearing, or too detractory and require a linear tube amplifier instead? 3. Consider a quadratic function f(t) with coordinates of (3,5), (2,4), and (4,4) such that a periodic signal (with To=6 seconds) can be created as follows where u(t) is the Heaviside unit step function as discussed in class. P(1) === f(t-n-6)-(u(t-n-6) - ult-6(n+1)]} f(t) Ir 11-0 p(t) with period of 6 seconds Hint: Be sure to pay careful attention and advantage to any symmetry observed! (a) Do you observe any symmetry of p(t)? If so, how does this impact its Fourier Analysis? (b) Utilizing Fourier synthesis, express by hand a sinusoidal expression for p(t) by determining the ao, an, and b, coefficients. Hint: Recall that you may need to use tabular integration or integration by parts! (c) What are the pros and cons of how you would represent this signal either with the p(t) expression above or the result of a synthesized Fourier analysis? In other words, what benefits does each signal version representation provide ? Which representation has more useful applications to the real world and WHY! odtry indi na enot dunyonin bazai vd work ini silodsing woyimsen akysing van 19090 in off swing eskiingh a to tumis of besig ovewonia HONA S COLTO, WOWert lehet tung buning u sal heating all glad fire ugel odont, insbure mise 1 181 Demo illops won wasioon ont touniola sy be oth the elezi oels einylana matang 8h 6,80 21 toalorstugator bogest niiw dostogavo fubraume SUIC1 on EHITA tailor to 1 to dost haug as and noinvi inandquios iniqua inbrooniast obe stor vinden Et St-best shigine 15wog mantapa do CIFF odt imotati (8) Baru brath y la sua rupe ne post of our doout sotahadlow for 4. Assuming a SAC (successive approximation converter) method is employed to sample a continuous analog signal and digitize it with a 13 bit ADC (analog to digital converter) clocked at 1MHz, how many microseconds would it take for this SAC to determine the digital representation of 1.53 volts, given that the ADC's reference voltages are strong CMOS values of 5.0 volts and ground (plus or minus less than 5%). What is the binary or hexadecimal value for this sample 1.53 volt analog value? If the classic digital ramp ADC method was used instead of the SAC at the same input frequency, what would the calculation time for this particular 1.53 volt example be? Assuming the maximum frequency of the analog waveform being converted is 4.2 kHz, what range of frequencies would be acceptable for the sampling rate frequency and which value would you choose if you were to construct and implement this circuit? 6.2-3 A periodic signal f(t) is expressed by the following Fourier series: f(t) = 3 cos t+sin (5t-)-2 cos (8t) fonara Wigmes of bavolume zil Beliones lingin an (a) Sketch the amplitude and phase spectra for the trigonometric series. (b) By inspection of spectra in part a, sketch the exponential Fourier series spectra. Ljub (c) By inspection of spectra in part b, write the exponential Fourier series for f(t), 2013 6.2-6 Figure P6.2-6 shows the trigonometric Fourier spectra of a periodic signal f(t). (a) By inspection of Fig. P6.2-6, find the trigonometric Fourier series representing 16. (b) By inspection of Fig. P6.2-6, sketch the exponential Fourier spectra of f(t). als 1 (e) By inspection of the exponential Fourier spectra obtained in part b, find the exponential Fourier series for f(t). (d) Show that the series found in parts a and c are equivalent. 8.2-7 Figure P6.2-7 shows the exponential Fourier spectra of a periodic signal f(t). -2 D. B jantz disa schoot sit amstami bas JUOD NOW 4 3 4 43 Fig. P6.2-6 -8 muah k T
Step by Step Solution
3.48 Rating (151 Votes )
There are 3 Steps involved in it

Get step-by-step solutions from verified subject matter experts