

Question: Lab 13 In this lab, we will implement some of the statistical methods discussed in Chapter 15. In particular, we will carry out chi-square test
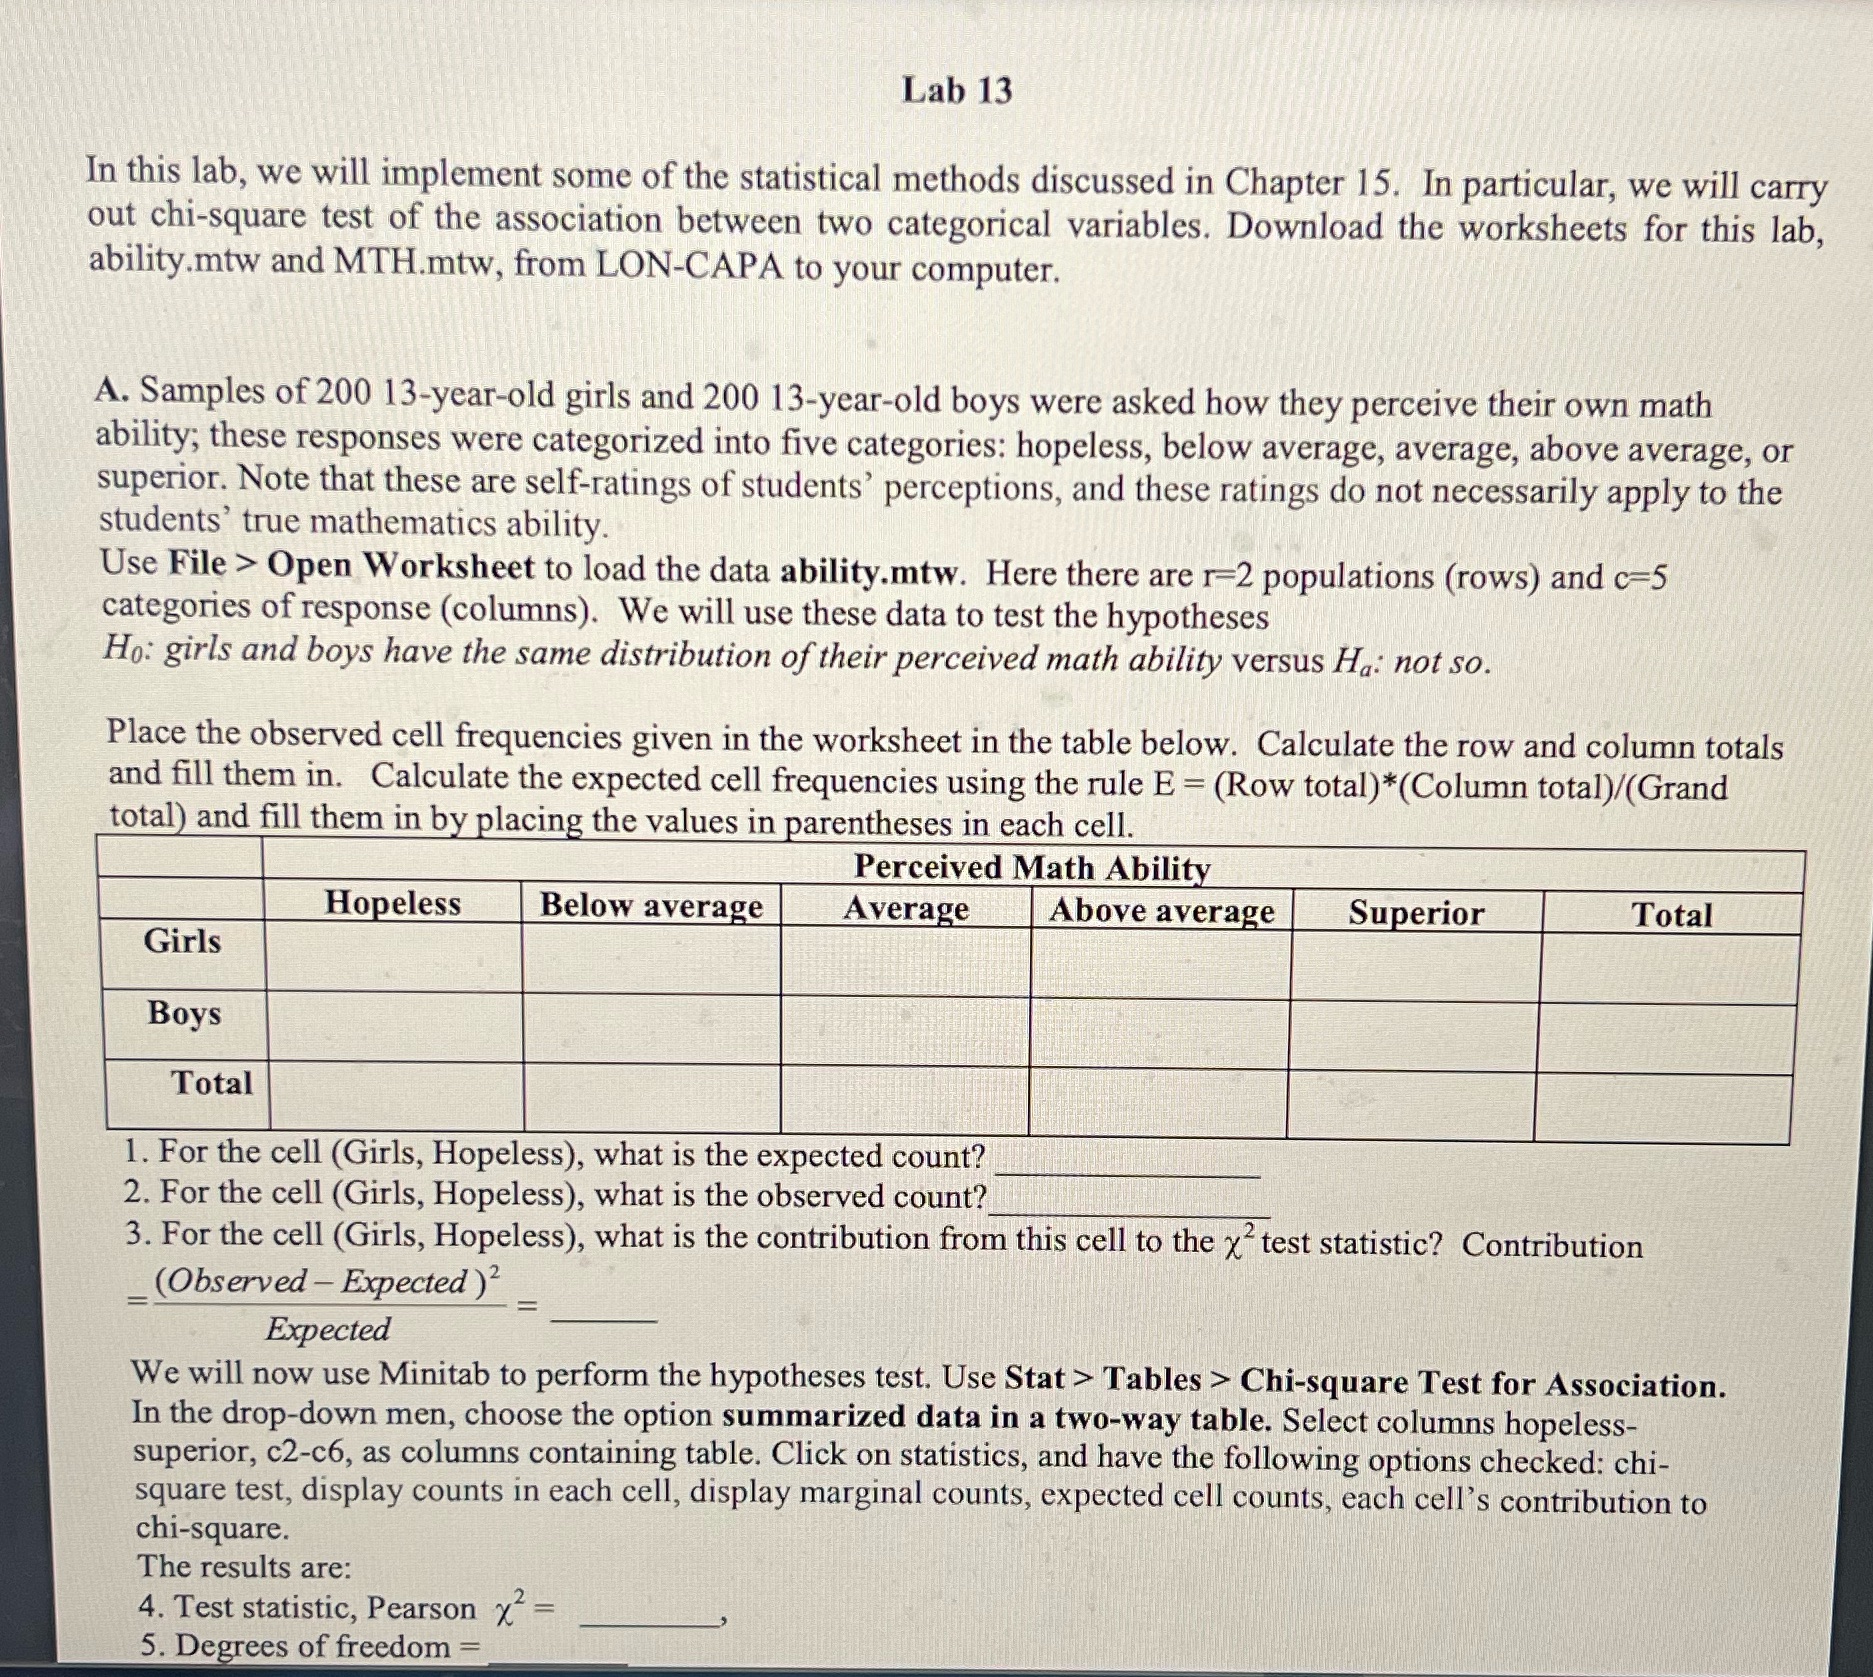
Lab 13 In this lab, we will implement some of the statistical methods discussed in Chapter 15. In particular, we will carry out chi-square test of the association between two categorical variables. Download the worksheets for this lab, abilitymtw and MTHmtw, from LON-CAPA to your computer. A. Samples of 200 13-yearold girls and 200 13-year-old boys were asked how they perceive their own math ability; these responses were categorized into ve categories: hopeless, below average, average, above average, or superior. Note that these are self-ratings ot'studcnts' perceptions, and these ratings do not necessarily apply to the students' true mathematics ability. Use File > Open Worksheet to load the data ability.mtw. Here there are r=2 populations (rows) and c=5 categories of response (columns). We will use these data to test the hypotheses Hg: girls and boys have the same distribution of their perceived math ability versus Ha: not so. Place the observed cell frequencies given in the worksheet in the table below. Calculate the row and column totals and ll them in. Calculate the expected cell frequencies using the rule E = (Row total)*(Column total)/(Grand total and ll them in b laein the values in arentheses in each cell. 1. For the cell (Girls, Hopeless), what is the expected count? 2. For the cell (Girls, Hopeless), what is the observed count? 3. For the cell (Girls, Hopeless), what is the contribution from this cell to the 31,2 test statistic? Contribution = (Observed Expected )2 _ Expected We will now use Minitab to perform the hypotheses test. Use Stat > Tables > Chi-square Test for Association. In the dropdown men, choose the option summarized data in a two-way table. Select columns hepeless superior, c2-c6, as columns containing table. Click on statistics, and have the following options checked: chi- square test, display counts in each cell, display marginal counts, expected cell counts, each cell's contribution to chisquare. The resutts are: 4. Test statistic, Pearson x2 = 5. De ees of freedom = .
Step by Step Solution
There are 3 Steps involved in it

Get step-by-step solutions from verified subject matter experts