

Question: Lab 2: Chapter 2 - Summarizing and Grouping Data 1. Listed below are the amounts of strontium-90 (in millibecquerels) in a simple random sample of
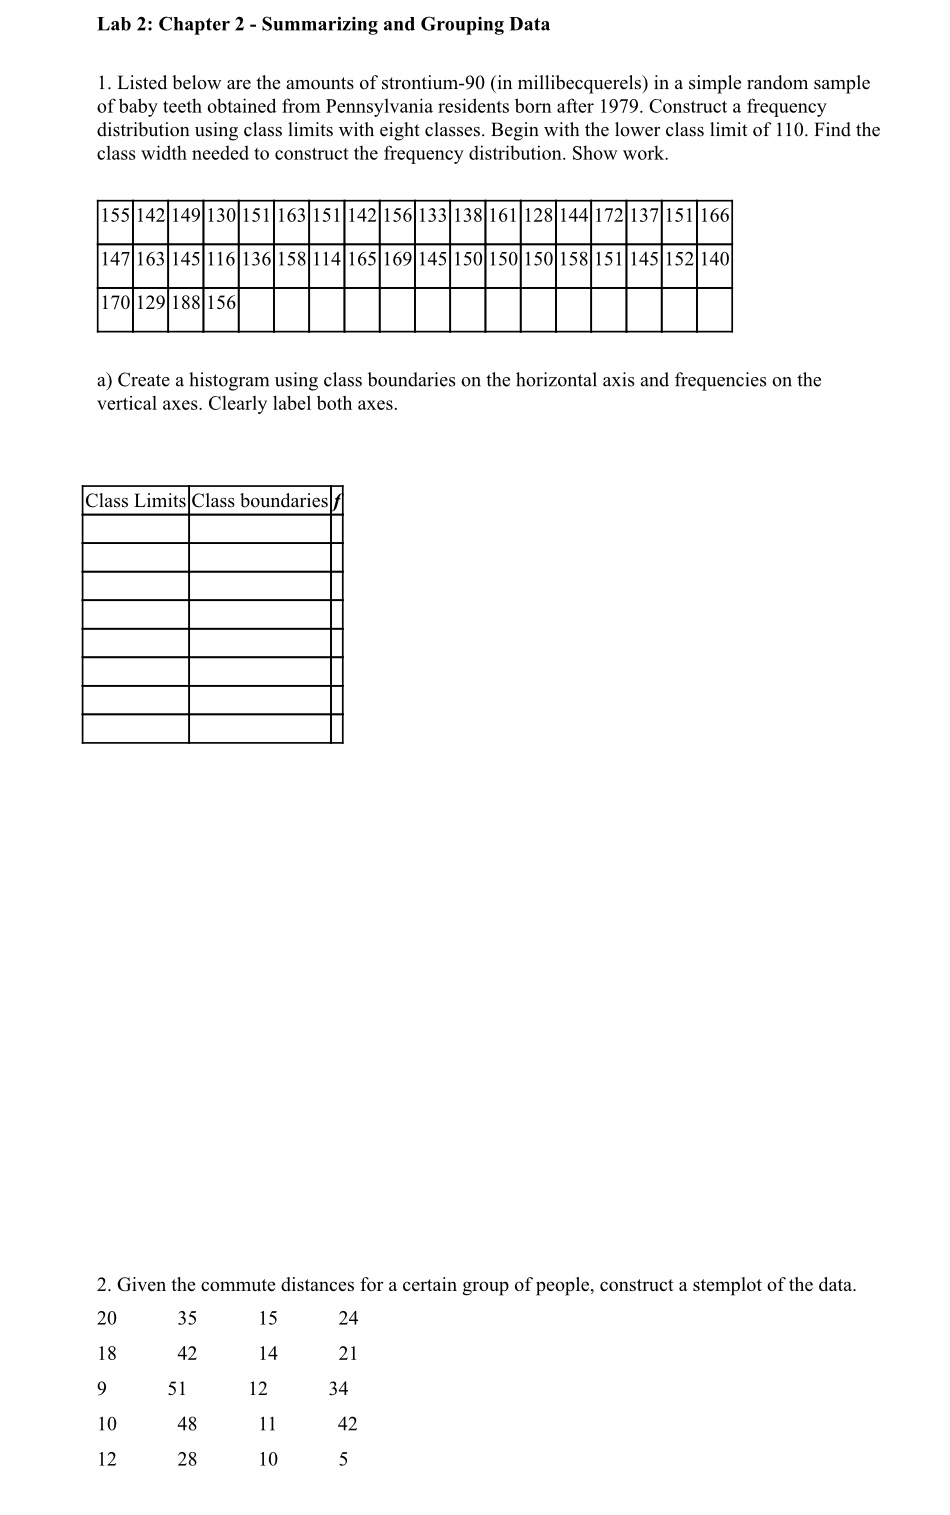
Lab 2: Chapter 2 - Summarizing and Grouping Data 1. Listed below are the amounts of strontium-90 (in millibecquerels) in a simple random sample of baby teeth obtained from Pennsylvania residents born after 1979. Construct a frequency distribution using class limits with eight classes. Begin with the lower class limit of 110. Find the class width needed to construct the frequency distribution. Show work. 55 142 149 130 151 163 151 142 156 133 138 161 128 144 172 137 151 166 147 163 145 116 136 158 114 165 169 145 150 150 150 158 151 145 152 140 170 129 188 156 a) Create a histogram using class boundaries on the horizontal axis and frequencies on the vertical axes. Clearly label both axes. Class Limits Class boundaries f 2. Given the commute distances for a certain group of people, construct a stemplot of the data. 20 35 15 24 18 42 14 21 9 51 12 34 10 48 11 42 12 28 10 5
Step by Step Solution
There are 3 Steps involved in it

Get step-by-step solutions from verified subject matter experts