

Question: Lab 2: Simulate Penny Fab Two using Best case situation of constant times, From simulation results, draw graphs similar to Figures 7.12, pg. 249. Comment
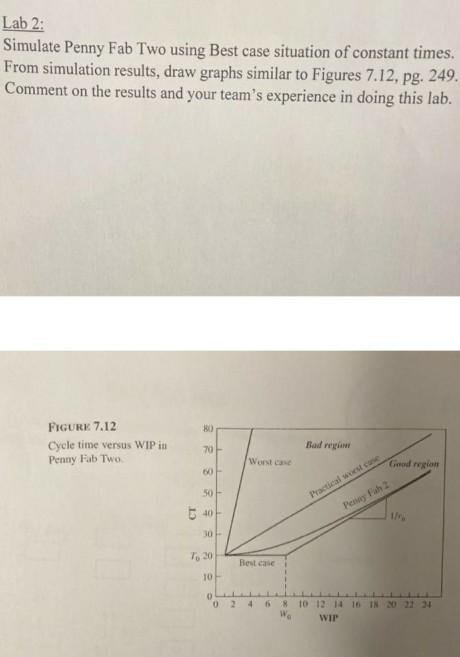
Lab 2: Simulate Penny Fab Two using Best case situation of constant times, From simulation results, draw graphs similar to Figures 7.12, pg. 249. Comment on the results and your team's experience in doing this lab. FIGURK 7.12 Cycle time versus WIP in Penny Fab Two 70 Bad regla Worst ca Good low 60 50 Practical Per Fah2 30 Best case 10 8 We 10 12 14 16 IN 2021 24 WIT Lab 2: Simulate Penny Fab Two using Best case situation of constant times, From simulation results, draw graphs similar to Figures 7.12, pg. 249. Comment on the results and your team's experience in doing this lab. FIGURK 7.12 Cycle time versus WIP in Penny Fab Two 70 Bad regla Worst ca Good low 60 50 Practical Per Fah2 30 Best case 10 8 We 10 12 14 16 IN 2021 24 WIT
Step by Step Solution
There are 3 Steps involved in it
1 Expert Approved Answer
Step: 1 Unlock

Question Has Been Solved by an Expert!
Get step-by-step solutions from verified subject matter experts
Step: 2 Unlock
Step: 3 Unlock