

Question: Lab 27 Network Management with ipMonitor Part 1: Install ipMonitor 1. ipMonitor is a free network monitoring software which identifies SNMP agents on a
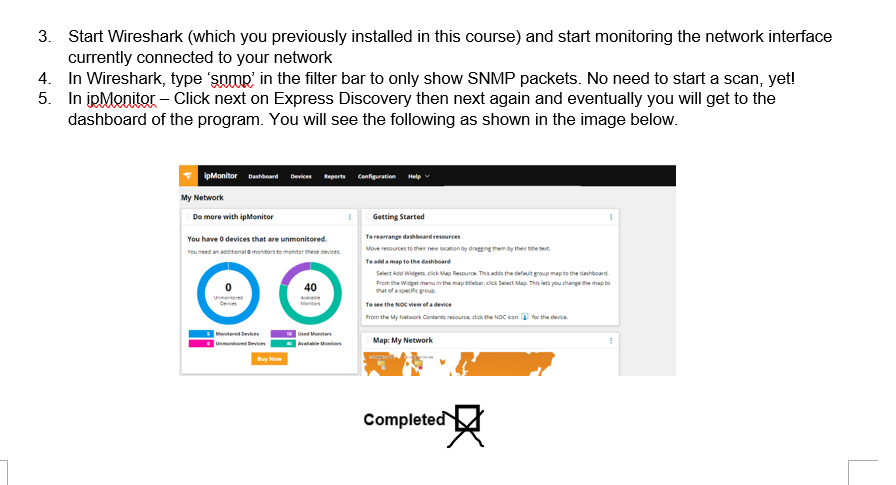
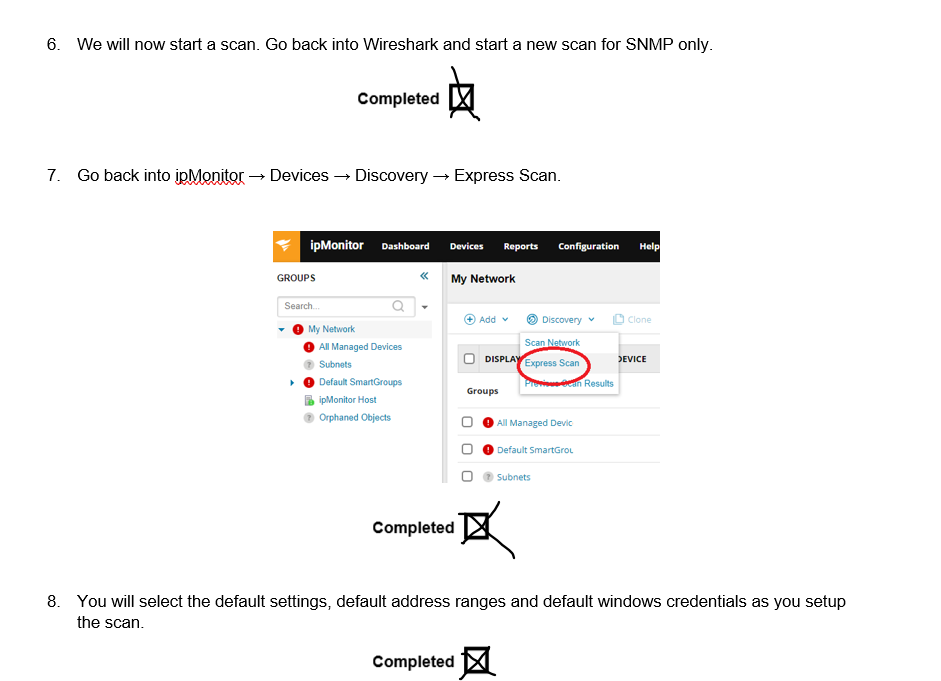
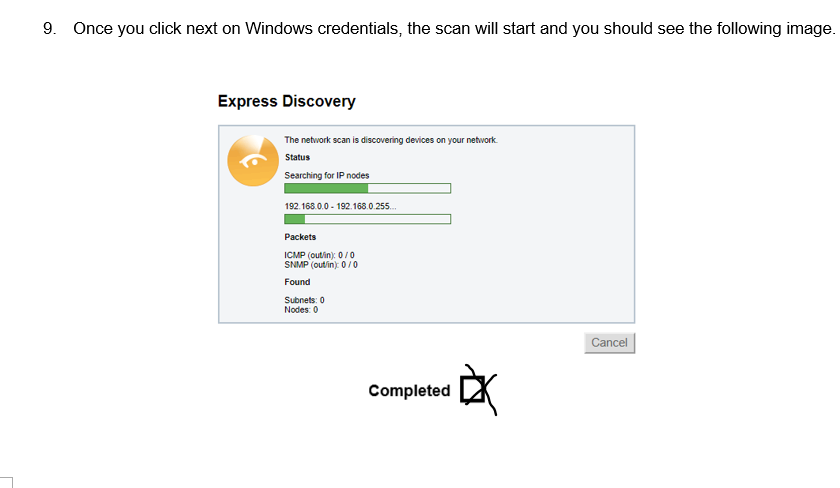
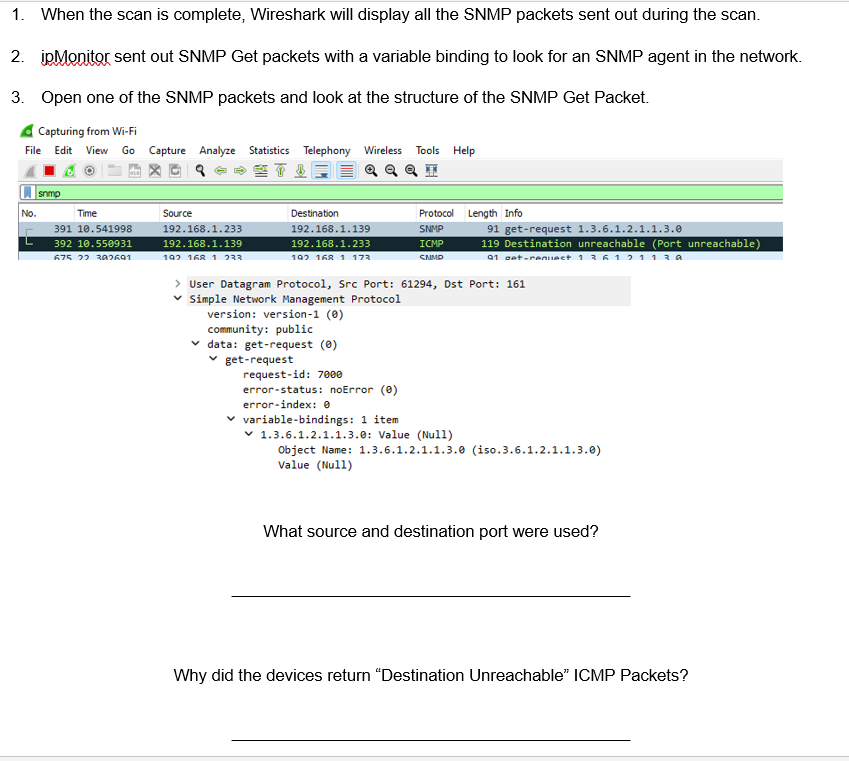
Lab 27 Network Management with ipMonitor Part 1: Install ipMonitor 1. ipMonitor is a free network monitoring software which identifies SNMP agents on a network. Click the link to go to the download page, register and install the software: https://www.solarwinds.com/free- tools/ipmonitor-free/registration 2. Click next through the first Run Service Settings 3. Click next through the first Run HTTP Server Settings 4. At the First Run Administrator Account screen, you can choose to use your Windows login or create a local admin account ("Standard ipMonitor Account") and create your own username and password. Click next on the next page and then click finish and the software is now installed. 5. A Completed Part 2: Run ipMonitor and Start Wireshark 1. To open the ipMonitor interface, hit the Windows key and type "ipMonitor Web Interface" 2. Log in with the username and password you created during the installation process. Attach a screenshot of the ipMonitor interface with your username shown (so I can tell that this is your installation) 3. Start Wireshark (which you previously installed in this course) and start monitoring the network interface currently connected to your network 4. In Wireshark, type 'snmp' in the filter bar to only show SNMP packets. No need to start a scan, yet! 5. In ipMonitor - Click next on Express Discovery then next again and eventually you will get to the dashboard of the program. You will see the following as shown in the image below. ipMonitor Dashboard Devices Reports Configuration Help My Network Do more with ipMonitor You have 0 devices that are unmonitored. You need an additional monitors to monitor these devices. Devices Monitored Devices Buy Now 10 Used Monitors Getting Started To rearrange dashboard resources Move resources to their new location by dragging them by their title text To add a map to the dashboard Select Add Widgets, click Map Resource. This adds the default group map to the dashboard. From the Widget menu in the map selebar, click Select Map. This lets you change the map to that of a specific group To see the NOC view of a device From the My Network Contents resource, click the NOC icon for the device. Map: My Network * Completed ! I 6. We will now start a scan. Go back into Wireshark and start a new scan for SNMP only. 7. Go back into ipMonitor Devices Discovery Express Scan. ipMonitor Dashboard Devices Reports Configuration Help GROUPS Completed Search... My Network All Managed Devices Subnets Default SmartGroups ipMonitor Host Orphaned Objects My Network Completed Discovery Scan Network DISPLAY Express Scan Completed Add v Groups Previse @can Results All Managed Devic Default SmartGrou Subnets Clone DEVICE 8. You will select the default settings, default address ranges and default windows credentials as you setup the scan. 9. Once you click next on Windows credentials, the scan will start and you should see the following image. Express Discovery The network scan is discovering devices on your network. Status Searching for IP nodes 192.168.0.0- 192.168.0.255... Packets ICMP (out/in): 0/0 SNMP (out/in): 0/0 Found Subnets: 0 Nodes: 0 Completed EX Cancel 1. When the scan is complete, Wireshark will display all the SNMP packets sent out during the scan. 2. ipMonitor sent out SNMP Get packets with a variable binding to look for an SNMP agent in the network. 3. Open one of the SNMP packets and look at the structure of the SNMP Get Packet. Capturing from Wi-Fi File Edit View Go Capture Analyze Statistics Telephony Wireless Tools Help e ee No. snmp Time 391 10.541998 392 10.550931 675 22 302691 Source 192.168.1.233 192.168.1.139 192 168 1 233 Destination 192.168.1.139 192.168.1.233 192 168 1 173 version: version-1 (0) community: public data: get-request (0) get-request Protocol Length Info SNMP ICMP SNMP > User Datagram Protocol, Src Port: 61294, Dst Port: 161 Simple Network Management Protocol request-id: 7000 error-status: noError (0) error-index: 0 91 get-request 1.3.6.1.2.1.1.3.0 119 Destination unreachable (Port unreachable) 91 get-renuect 1 3 6 1 2 1 1 3 0 variable-bindings: 1 item 1.3.6.1.2.1.1.3.0: Value (Null) Object Name: 1.3.6.1.2.1.1.3.0 (iso.3.6.1.2.1.1.3.0) Value (Null) What source and destination port were used? Why did the devices return "Destination Unreachable" ICMP Packets?
Step by Step Solution
There are 3 Steps involved in it
Based on the information shown in the screenshot What sour... View full answer

Get step-by-step solutions from verified subject matter experts