

Question: Lab 7: Confidence Intervals and Hypothesis Testing (Part 1) Purpose: To become familiar with R functionality for computing confidence intervals and conducting hypothesis tests. EXERCISE
Lab 7: Confidence Intervals and Hypothesis Testing (Part 1)
Purpose: To become familiar with R functionality for computing confidence intervals and conducting hypothesis tests.
EXERCISE
(1) Compute a 95% confidence interval for the true mean lead content in the Sebring, OH
water system.
(2) Build an 80% confidence interval for the mean lead concentration in the Sebring, OH
water supply. Use the t.test function.
(3) Conduct a hypothesis test that the proportion of minority visitors to Great Smokey
Mountains National Park (GSMNP) is also 13%. A survey of visitors showed 1,221
minorities out of 10,248 visitors.
(4) Build a 99% confidence interval for the proportion of minority visitors to Great
Smokey Mountains National Park (GSMNP). A survey of visitors showed 1,221 minorities
out of 10,248 visitors.
(5) Redo Exercise 3, but using binom.test. Comment on any differences in the results
between prop.test and binom.test in terms of the hypothesis test and the confidence
interval.
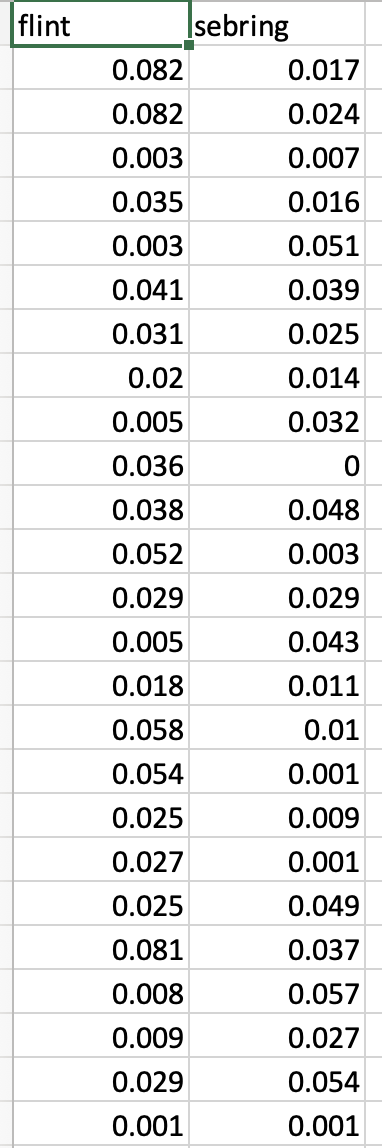
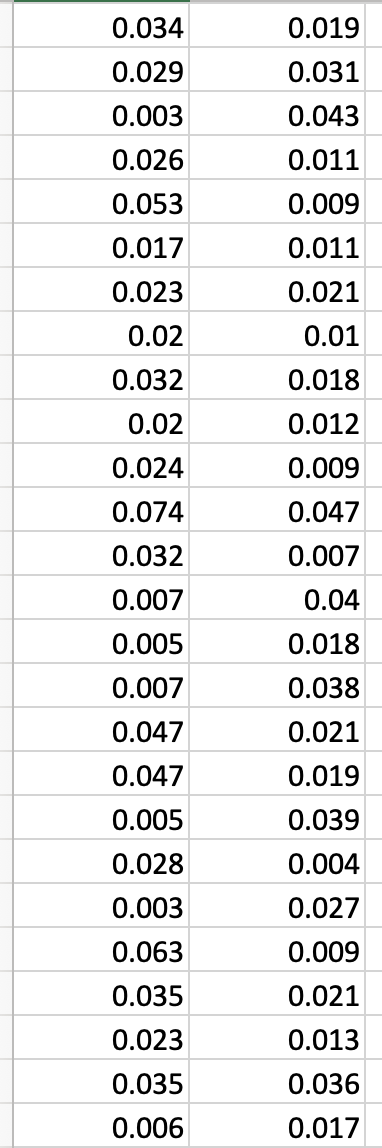
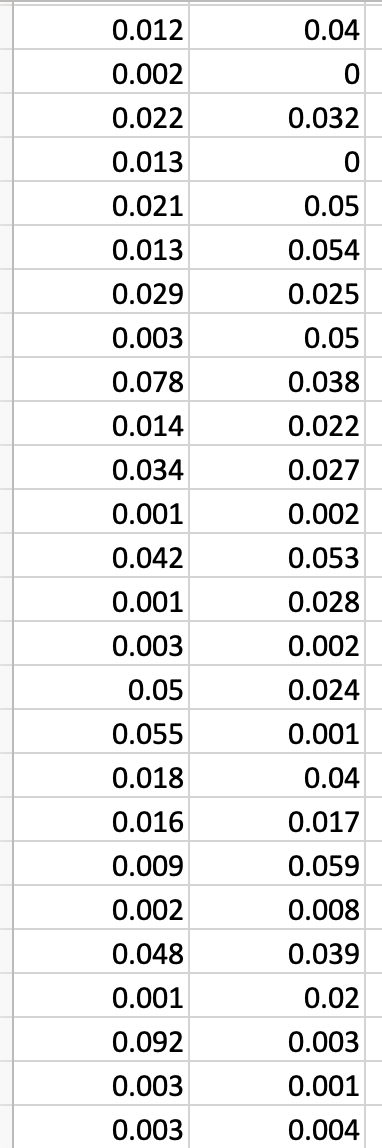
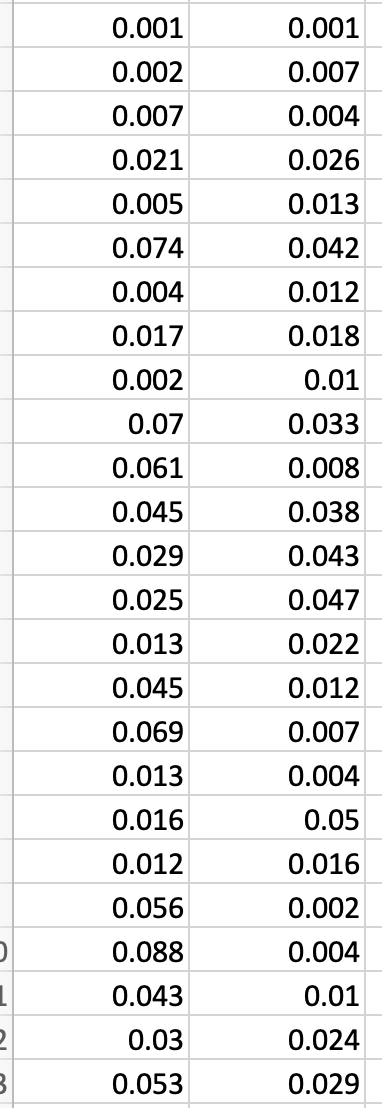
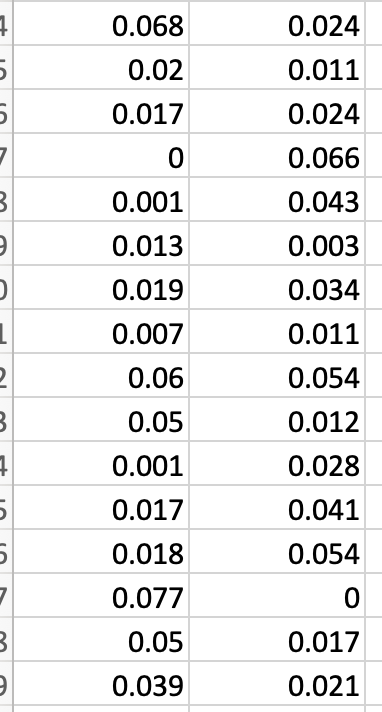
flint sebring 0.082 0.017 0.082 0.024 0.003 0.007 0.035 0.016 0.003 0.051 0.041 0.039 0.031 0.025 0.02 0.014 0.005 0.032 0.036 O 0.038 0.048 0.052 0.003 0.029 0.029 0.005 0.043 0.018 0.011 0.058 0.01 0.054 0.001 0.025 0.009 0.027 0.001 0.025 0.049 0.081 0.037 0.008 0.057 0.009 0.027 0.029 0.054 0.001 0.001\f0.012 0.04 0.002 0 0.022 0.032 0.013 O 0.021 0.05 0.013 0.054 0.029 0.025 0.003 0.05 0.078 0.038 0.014 0.022 0.034 0.027 0.001 0.002 0.042 0.053 0.001 0.028 0.003 0.002 0.05 0.024 0.055 0.001 0.018 0.04 0.016 0.017 0.009 0.059 0.002 0.008 0.048 0.039 0.001 0.02 0.092 0.003 0.003 0.001 0.003 0.0040.001 0.001 0.002 0.007 0.007 0.004 0.021 0.026 0.005 0.013 0.074 0.042 0.004 0.012 0.017 0.018 0.002 0.01 0.07 0.033 0.061 0.008 0.045 0.038 0.029 0.043 0.025 0.047 0.013 0.022 0.045 0.012 0.069 0.007 0.013 0.004 0.016 0.05 0.012 0.016 0.056 0.002 0.088 0.004 0.043 0.01 0.03 0.024 0.053 0.029
Step by Step Solution
There are 3 Steps involved in it

Get step-by-step solutions from verified subject matter experts