

Question: LAB 8: WORK SAMPLING Introduction Work sampling is based upon the laws of probability. A sample taken at random from a large group tends to
LAB 8: WORK SAMPLING
- Introduction
Work sampling is based upon the laws of probability. A sample taken at random from a large group tends to have the same pattern of distribution as the large group or universe. If the sample is large enough, the characteristics of the sample will differ but little from the characteristics of the group. Sample is the term used for the large group. Obtaining and analyzing only a part of the universe is known as sampling (Barnes, 1980).
- Objective
After completing this activity, students will be able to
- Understand the fundamentals of work sampling
- Determine standard time using work sampling
- Lab Procedure
The bars in figure 1 represent to scale the 240 minutes of the forenoon and the afternoon for five consecutive working days (Monday through Friday) a full 40-hour week (2400-minutes). The results of a continuous time study of one operator for one week are shown. White represents working time while Black represents idle time. The total actual working time for the week from the time study is 2035 minutes while the total idle time for the week from the time study is 365 minutes.
Percentage of working time =
Percentage of idle time =
Now see how you can obtain similar information by the use of random sampling. You can make your own random observations by following the instructions below:
- Draw at random 20 vertical marks across each of the ten bars shown on the given sheet. Do not space the marks at regular intervals (space marks randomly along the entire length of the line).
- These marks represent 20 random observations made of the operator during the forenoon and the afternoon.
- Now count the number of times your marks intersects with the black portion of the bars and write this number in the box at the end of the line.
- Then add the number of idle observations and divide this total by 200. This gives you the percentage of the week that the operator was idle by the random sampling procedure.
- Now compare your answer with the actual idle percentage of 15.2 %, which was originally obtained by time study.
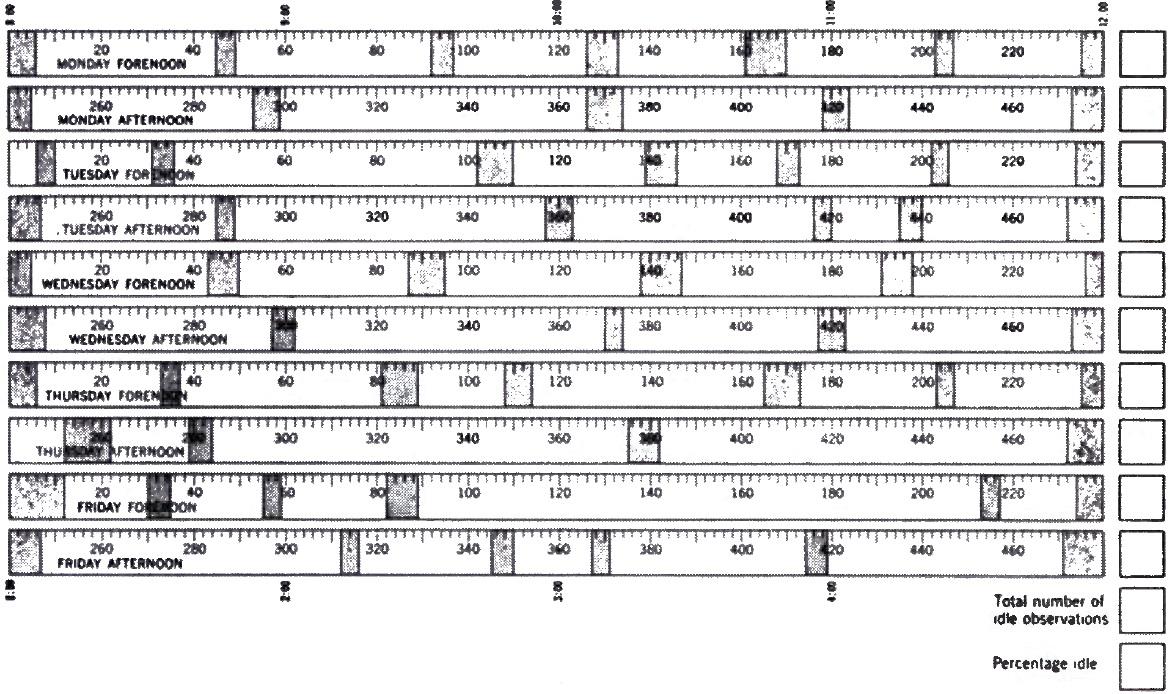 Figure 1: Working time and idle time for one operator for five consecutive working days.
Figure 2 shows a work sampling study. results of random observations shown on the bars represent one working day.
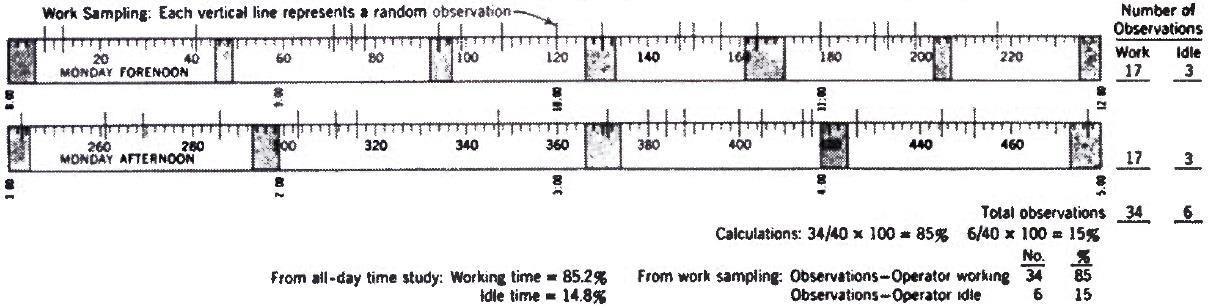
Figure 2: Work sampling study for one working day
Calculations:
- Determination of the Accuracy of a given number of observations. Consider a confidence level of 95%.
- Determination of the number of observations require for a given accuracy.
- Determining standard time using work sampling: Assume total work time is 2400 minutes per week, number of parts produced per day is 330, actual working time in percent is obtained from sampling sheet, the average performance rating for the worker is 110%, and the total allowances are 15%. Follow procedures provided in the lecture notes for determining the standard time.
- Lab Report Format
- Cover page
- Introduction to work sampling
- Methodology
- Calculations
- Conclusion
- Attach Sampling sheet
Step by Step Solution
There are 3 Steps involved in it

Get step-by-step solutions from verified subject matter experts