

Question: Lab Module 1: Quantitative Data and Numerical Sum- maries You conduct a poll of 150 students and ask the following question: How many hours
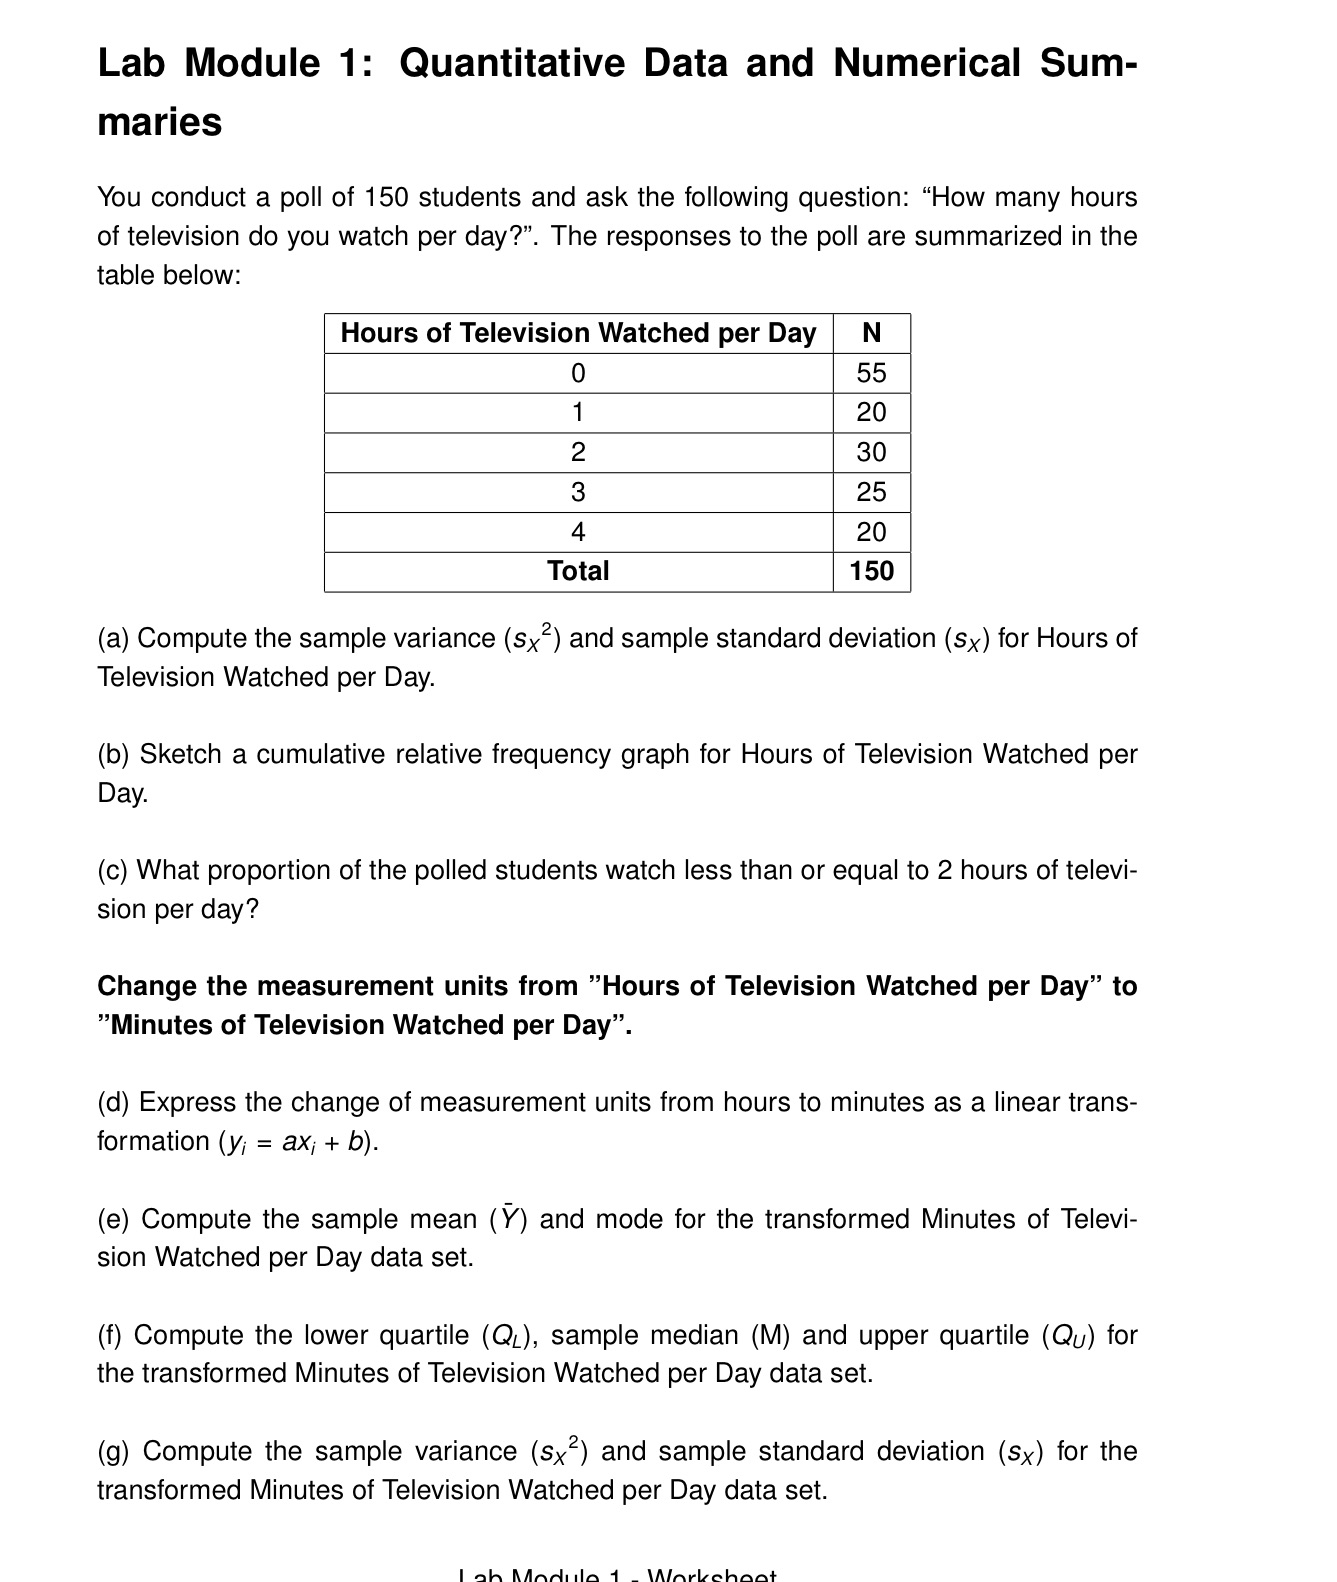
Lab Module 1: Quantitative Data and Numerical Sum- maries You conduct a poll of 150 students and ask the following question: "How many hours of television do you watch per day?". The responses to the poll are summarized in the table below: Hours of Television Watched per Day N 0 55 1 20 2 30 3 25 4 20 Total 150 (a) Compute the sample variance (sx) and sample standard deviation (SX) for Hours of Television Watched per Day. (b) Sketch a cumulative relative frequency graph for Hours of Television Watched per Day. (c) What proportion of the polled students watch less than or equal to 2 hours of televi- sion per day? Change the measurement units from "Hours of Television Watched per Day" to "Minutes of Television Watched per Day". (d) Express the change of measurement units from hours to minutes as a linear trans- formation (y; = ax; + b). (e) Compute the sample mean (Y) and mode for the transformed Minutes of Televi- sion Watched per Day data set. (f) Compute the lower quartile (QL), sample median (M) and upper quartile (Qu) for the transformed Minutes of Television Watched per Day data set. (g) Compute the sample variance (Sx) and sample standard deviation (SX) for the transformed Minutes of Television Watched per Day data set. Lab Module 1. Worksheet
Step by Step Solution
There are 3 Steps involved in it

Get step-by-step solutions from verified subject matter experts