Question: Lab4 Adiabatic processes Objective: To learn how to distinguish between convective and orographic processes, and to work with the various lapse rates that we encountered
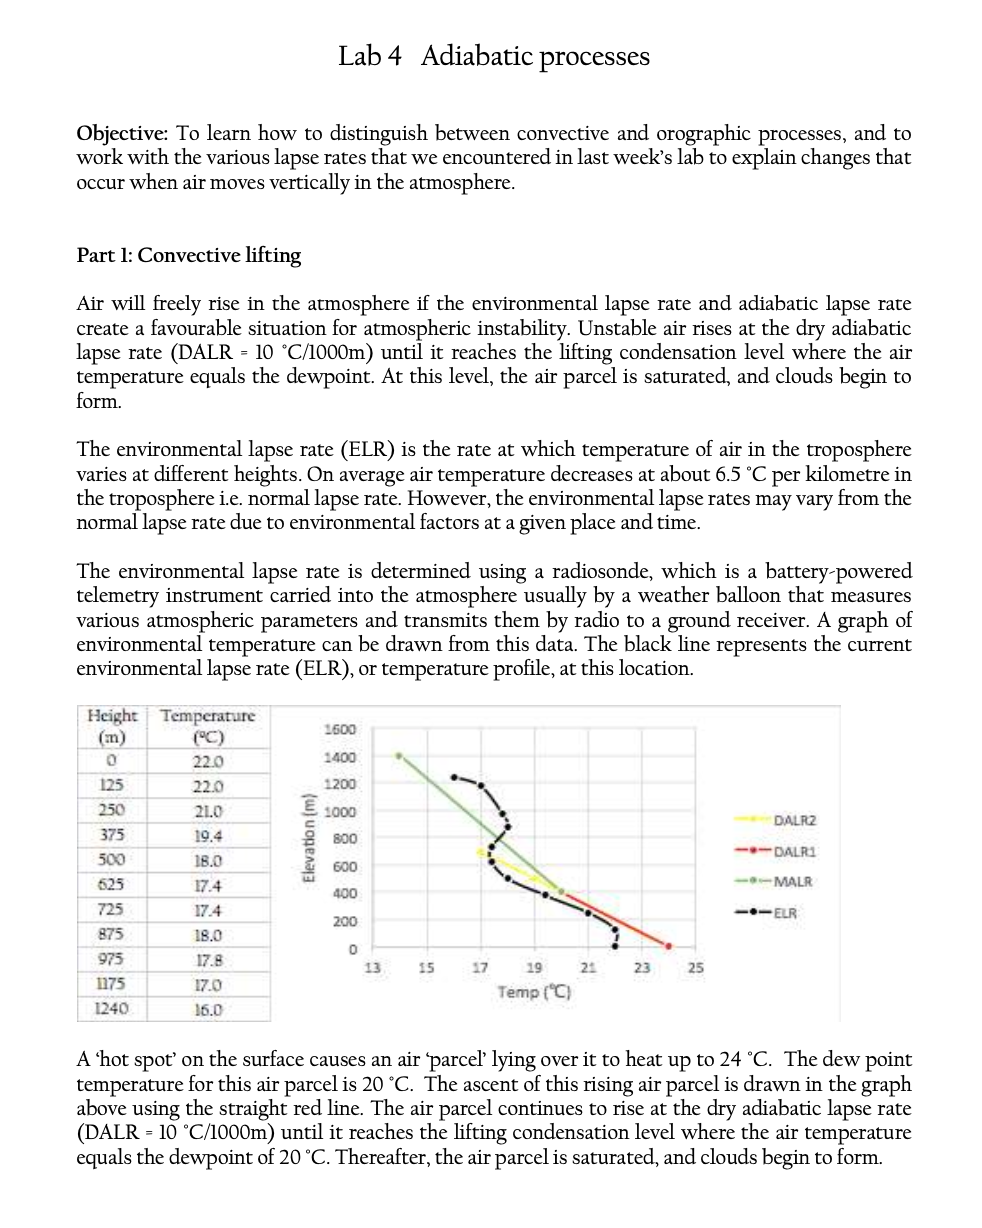
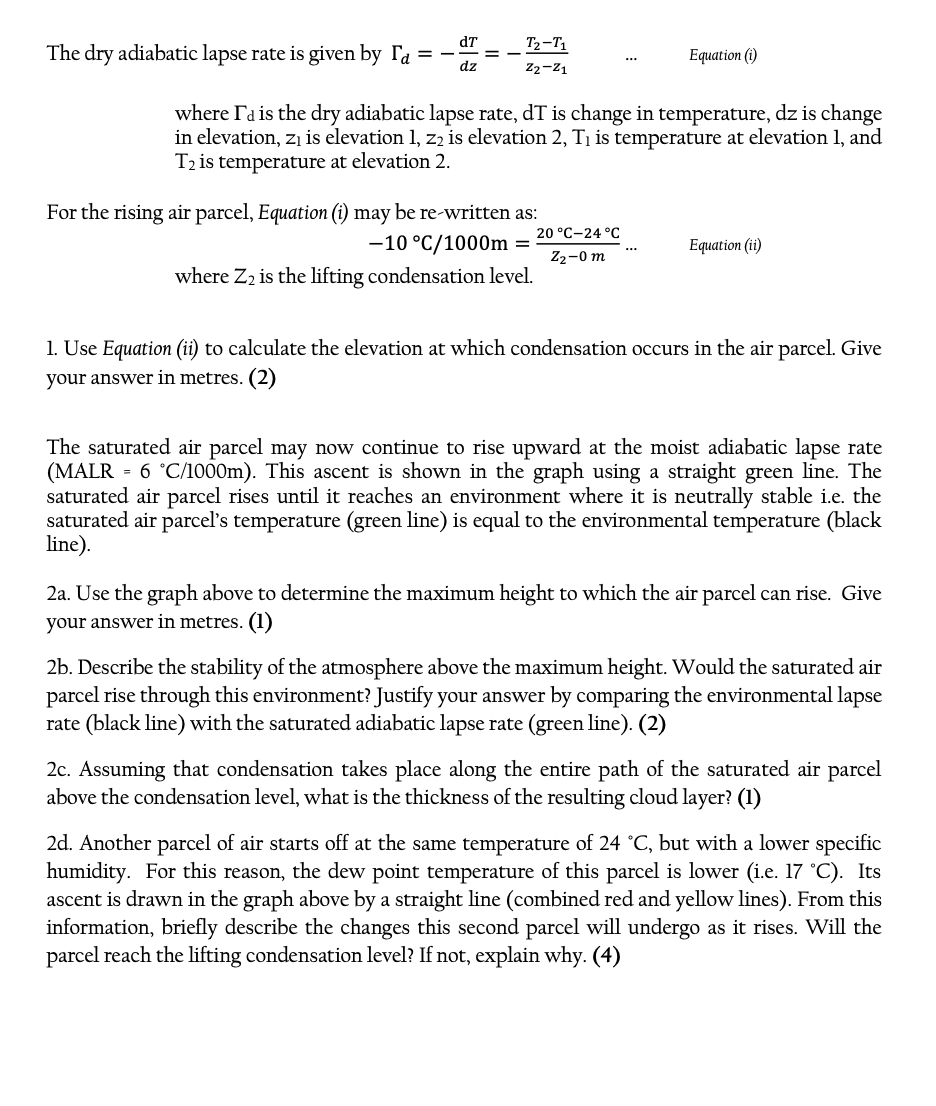
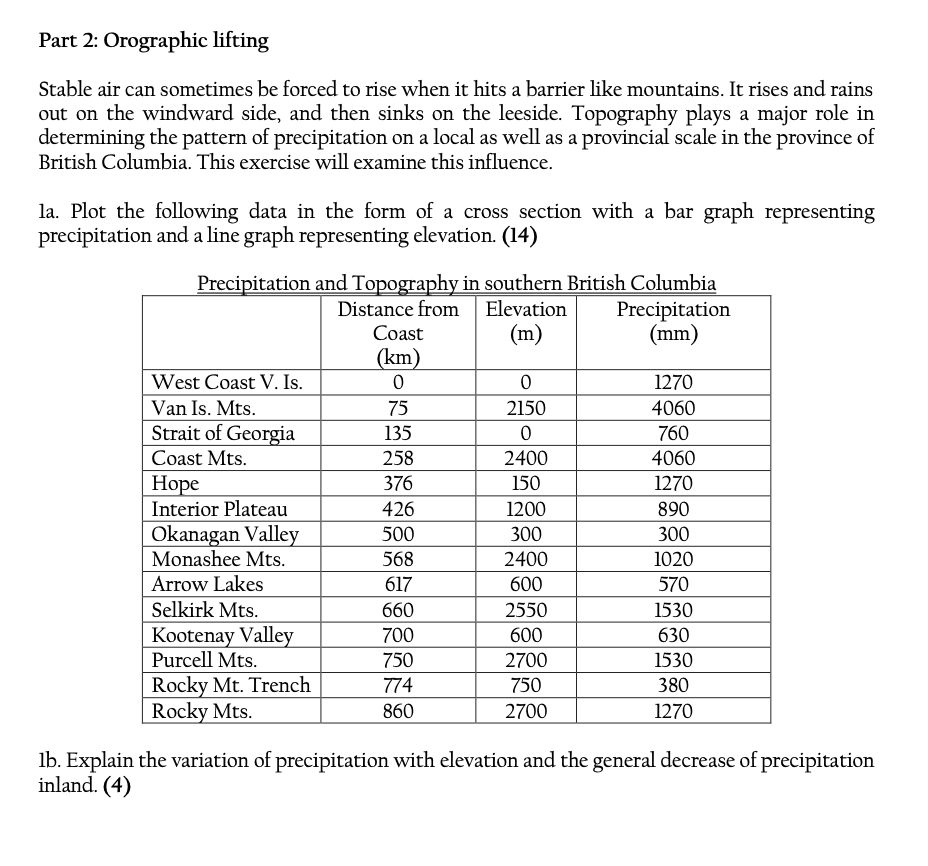
Lab4 Adiabatic processes Objective: To learn how to distinguish between convective and orographic processes, and to work with the various lapse rates that we encountered in last week's lab to explain changes that occur when air moves vertically in the atmosphere. Part 1: Convective lifting Air will freely rise in the atmosphere if the environmental lapse rate and adiabatic lapse rate create a favourable situation for atmospheric instability. Unstable air rises at the dry adiabatic lapse rate (DALR = 10 *C/1000m) until it reaches the lifting condensation level where the air temperature equals the dewpoint. At this level, the air parcel is saturated, and clouds begin to form. The environmental lapse rate (ELR) is the rate at which temperature of air in the troposphere varies at different heights. On average air temperature decreases at about 6.5 C per kilometre in the troposphere i.e. normal lapse rate. However, the environmental lapse rates may vary from the normal lapse rate due to environmental factors at a given place and time. The environmental lapse rate is determined using a radiosonde, which is a battery-powered telemetry instrument carried into the atmosphere usually by a weather balloon that measures various atmospheric parameters and transmits them by radio to a ground receiver. A graph of environmental temperature can be drawn from this data. The black line represents the current environmental lapse rate (ELR), or temperature profile, at this location. Height Temperature (m) (8c) a 770 2400 135 770 1200 tomy, 5. Pr EF cna 250 210 = 3009 hs pads 3/3 1o.4 = mo x 7 9D 500) 18.0 = 600 ~ DALRA 425 i = rs: MALR = 4 400 hs 735 v4 ss . eOFLR 200 875 18.0 4 O75 ve 0 . ee! wr once 3 5 7 19 23 23 25 h75 77.0 . } = iemp | C} 140 16.0 A 'hot spot' on the surface causes an air 'parcel' lying over it to heat up to 24 C. The dew point temperature for this air parcel is 20C. The ascent of this rising air parcel is drawn in the graph above using the straight red line. The air parcel continues to rise at the dry adiabatic lapse rate (DALR = 10 C/1000m) until it reaches the lifting condensation level where the air temperature equals the dewpoint of 20 C. Thereafter, the air parcel is saturated, and clouds begin to form. The dry adiabatic lapse rate is given by Tg = T=-2h ve Equation (i) dz Za2Z2y where Ia is the dry adiabatic lapse rate, dT is change in temperature, dz is change in elevation, z) is elevation 1, z2 is elevation 2, T) is temperature at elevation 1, and T2 is temperature at elevation 2. For the rising air parcel, Equation (i) may be re-written as: =10C/1000m = 2274 E auction (i Z2-O0m where Z2 is the lifting condensation level. 1. Use Equation (ii) to calculate the elevation at which condensation occurs in the air parcel. Give your answer in metres. (2) The saturated air parcel may now continue to rise upward at the moist adiabatic lapse rate (MALR = 6 C/1000m). This ascent is shown in the graph using a straight green line. The saturated air parcel rises until it reaches an environment where it is neutrally stable ie. the saturated air parcel's temperature (green line) is equal to the environmental temperature (black line). 2a. Use the graph above to determine the maximum height to which the air parcel can rise. Give your answer in metres. (1) 2b. Describe the stability of the atmosphere above the maximum height. Would the saturated air parcel rise through this environment? Justify your answer by comparing the environmental lapse rate (black line) with the saturated adiabatic lapse rate (green line). (2) 2c. Assuming that condensation takes place along the entire path of the saturated air parcel above the condensation level, what is the thickness of the resulting cloud layer? (1) 2d. Another parcel of air starts off at the same temperature of 24 C, but with a lower specific humidity. For this reason, the dew point temperature of this parcel is lower (ie. 17 C). Its ascent is drawn in the graph above by a straight line (combined red and yellow lines). From this information, briefly describe the changes this second parcel will undergo as it rises. Will the parcel reach the lifting condensation level? If not, explain why. (4) Part 2: Orographic lifting Stable air can sometimes be forced to rise when it hits a barrier like mountains. It rises and rains out on the windward side, and then sinks on the leeside. Topography plays a major role in determining the pattern of precipitation on a local as well as a provincial scale in the province of British Columbia. This exercise will examine this influence. la. Plot the following data in the form of a cross section with a bar graph representing precipitation and a line graph representing elevation. (14) Precipitation and Topography in southern British Columbia Distance from Elevation Precipitation Coast (m) (mm) (km) West Coast V. Is. 0 0 1270 Van Is. Mts 75 2150 4060 Strait of Georgia 135 0 760 Coast Mts 258 2400 4060 Hope 376 150 1270 Interior Plateau 426 200 390 Okanagan Valley 500 300 300 Monashee Mts. 568 2400 1020 Arrow Lakes 617 600 570 Selkirk Mts. 660 2550 1530 Kootenay Valley 700 600 630 Purcell Mts. 750 2700 1530 Rocky Mt. Trench 774 750 380 Rocky Mts. 860 2700 1270 1b. Explain the variation of precipitation with elevation and the general decrease of precipitation inland. (4)
Step by Step Solution
There are 3 Steps involved in it
1 Expert Approved Answer
Step: 1 Unlock
Question Has Been Solved by an Expert!
Get step-by-step solutions from verified subject matter experts
Step: 2 Unlock
Step: 3 Unlock
Students Have Also Explored These Related Accounting Questions!