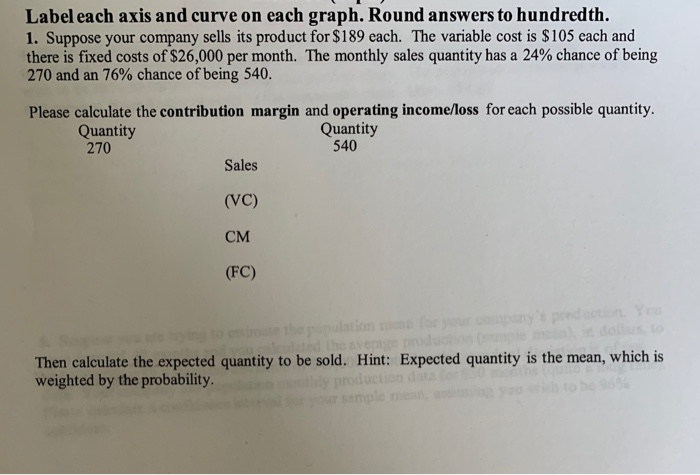
Question: Label each axis and curve on each graph. Round answers to hundredth. 1. Suppose your company sells its product for $189 each. The variable cost

Label each axis and curve on each graph. Round
Label each axis and curve on each graph. Round answers to hundredth. 1. Suppose your company sells its product for $189 each. The variable cost is $105 each and there is fixed costs of $26,000 per month. The monthly sales quantity has a 24% chance of being 270 and an 76% chance of being 540. Please calculate the contribution margin and operating income/loss for each possible quantity. Quantity Quantity 270 540 Sales (VC) CM (FC) Then calculate the expected quantity to be sold. Hint: Expected quantity is the mean, which is weighted by the probability. production de Label each axis and curve on each graph. Round answers to hundredth. 1. Suppose your company sells its product for $189 each. The variable cost is $105 each and there is fixed costs of $26,000 per month. The monthly sales quantity has a 24% chance of being 270 and an 76% chance of being 540. Please calculate the contribution margin and operating income/loss for each possible quantity. Quantity Quantity 270 540 Sales (VC) CM (FC) Then calculate the expected quantity to be sold. Hint: Expected quantity is the mean, which is weighted by the probability. production de

Step by Step Solution

There are 3 Steps involved in it

1 Expert Approved Answer
Step: 1 Unlock blur-text-image
Question Has Been Solved by an Expert!

Get step-by-step solutions from verified subject matter experts

Step: 2 Unlock
Step: 3 Unlock

Students Have Also Explored These Related General Management Questions!