

Question: Label Each Part 1 through 3: Question 5, Problem 4.39 Part 1 of 3 100 points Points: 5 of 20 Given the following data, use
Label Each Part 1 through 3:
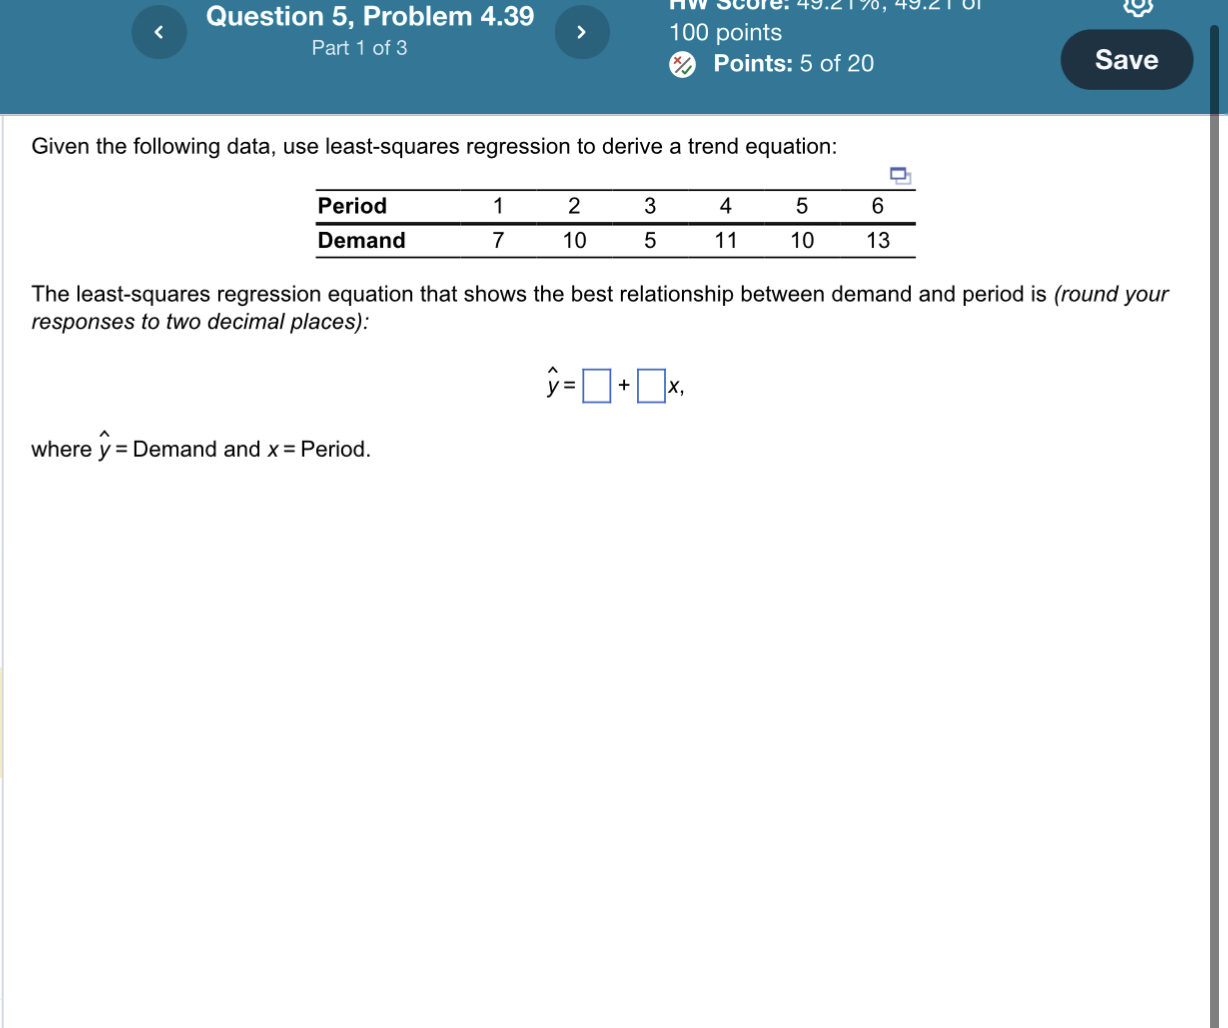
Question 5, Problem 4.39 Part 1 of 3 100 points Points: 5 of 20 Given the following data, use least-squares regression to derive a trend equation: The least-squares regression equation that shows the best relationship between demand and period is (round your responses to two decimal places): y^=+x where y^= Demand and x= Period
Step by Step Solution
There are 3 Steps involved in it
1 Expert Approved Answer
Step: 1 Unlock

Question Has Been Solved by an Expert!
Get step-by-step solutions from verified subject matter experts
Step: 2 Unlock
Step: 3 Unlock