

Question: laboM QAlex andT AS Vertical Horizontal Range Price level Range (recession) Upsloping or Intermediate Range Qr Real GDP Refer to the graph above. What does
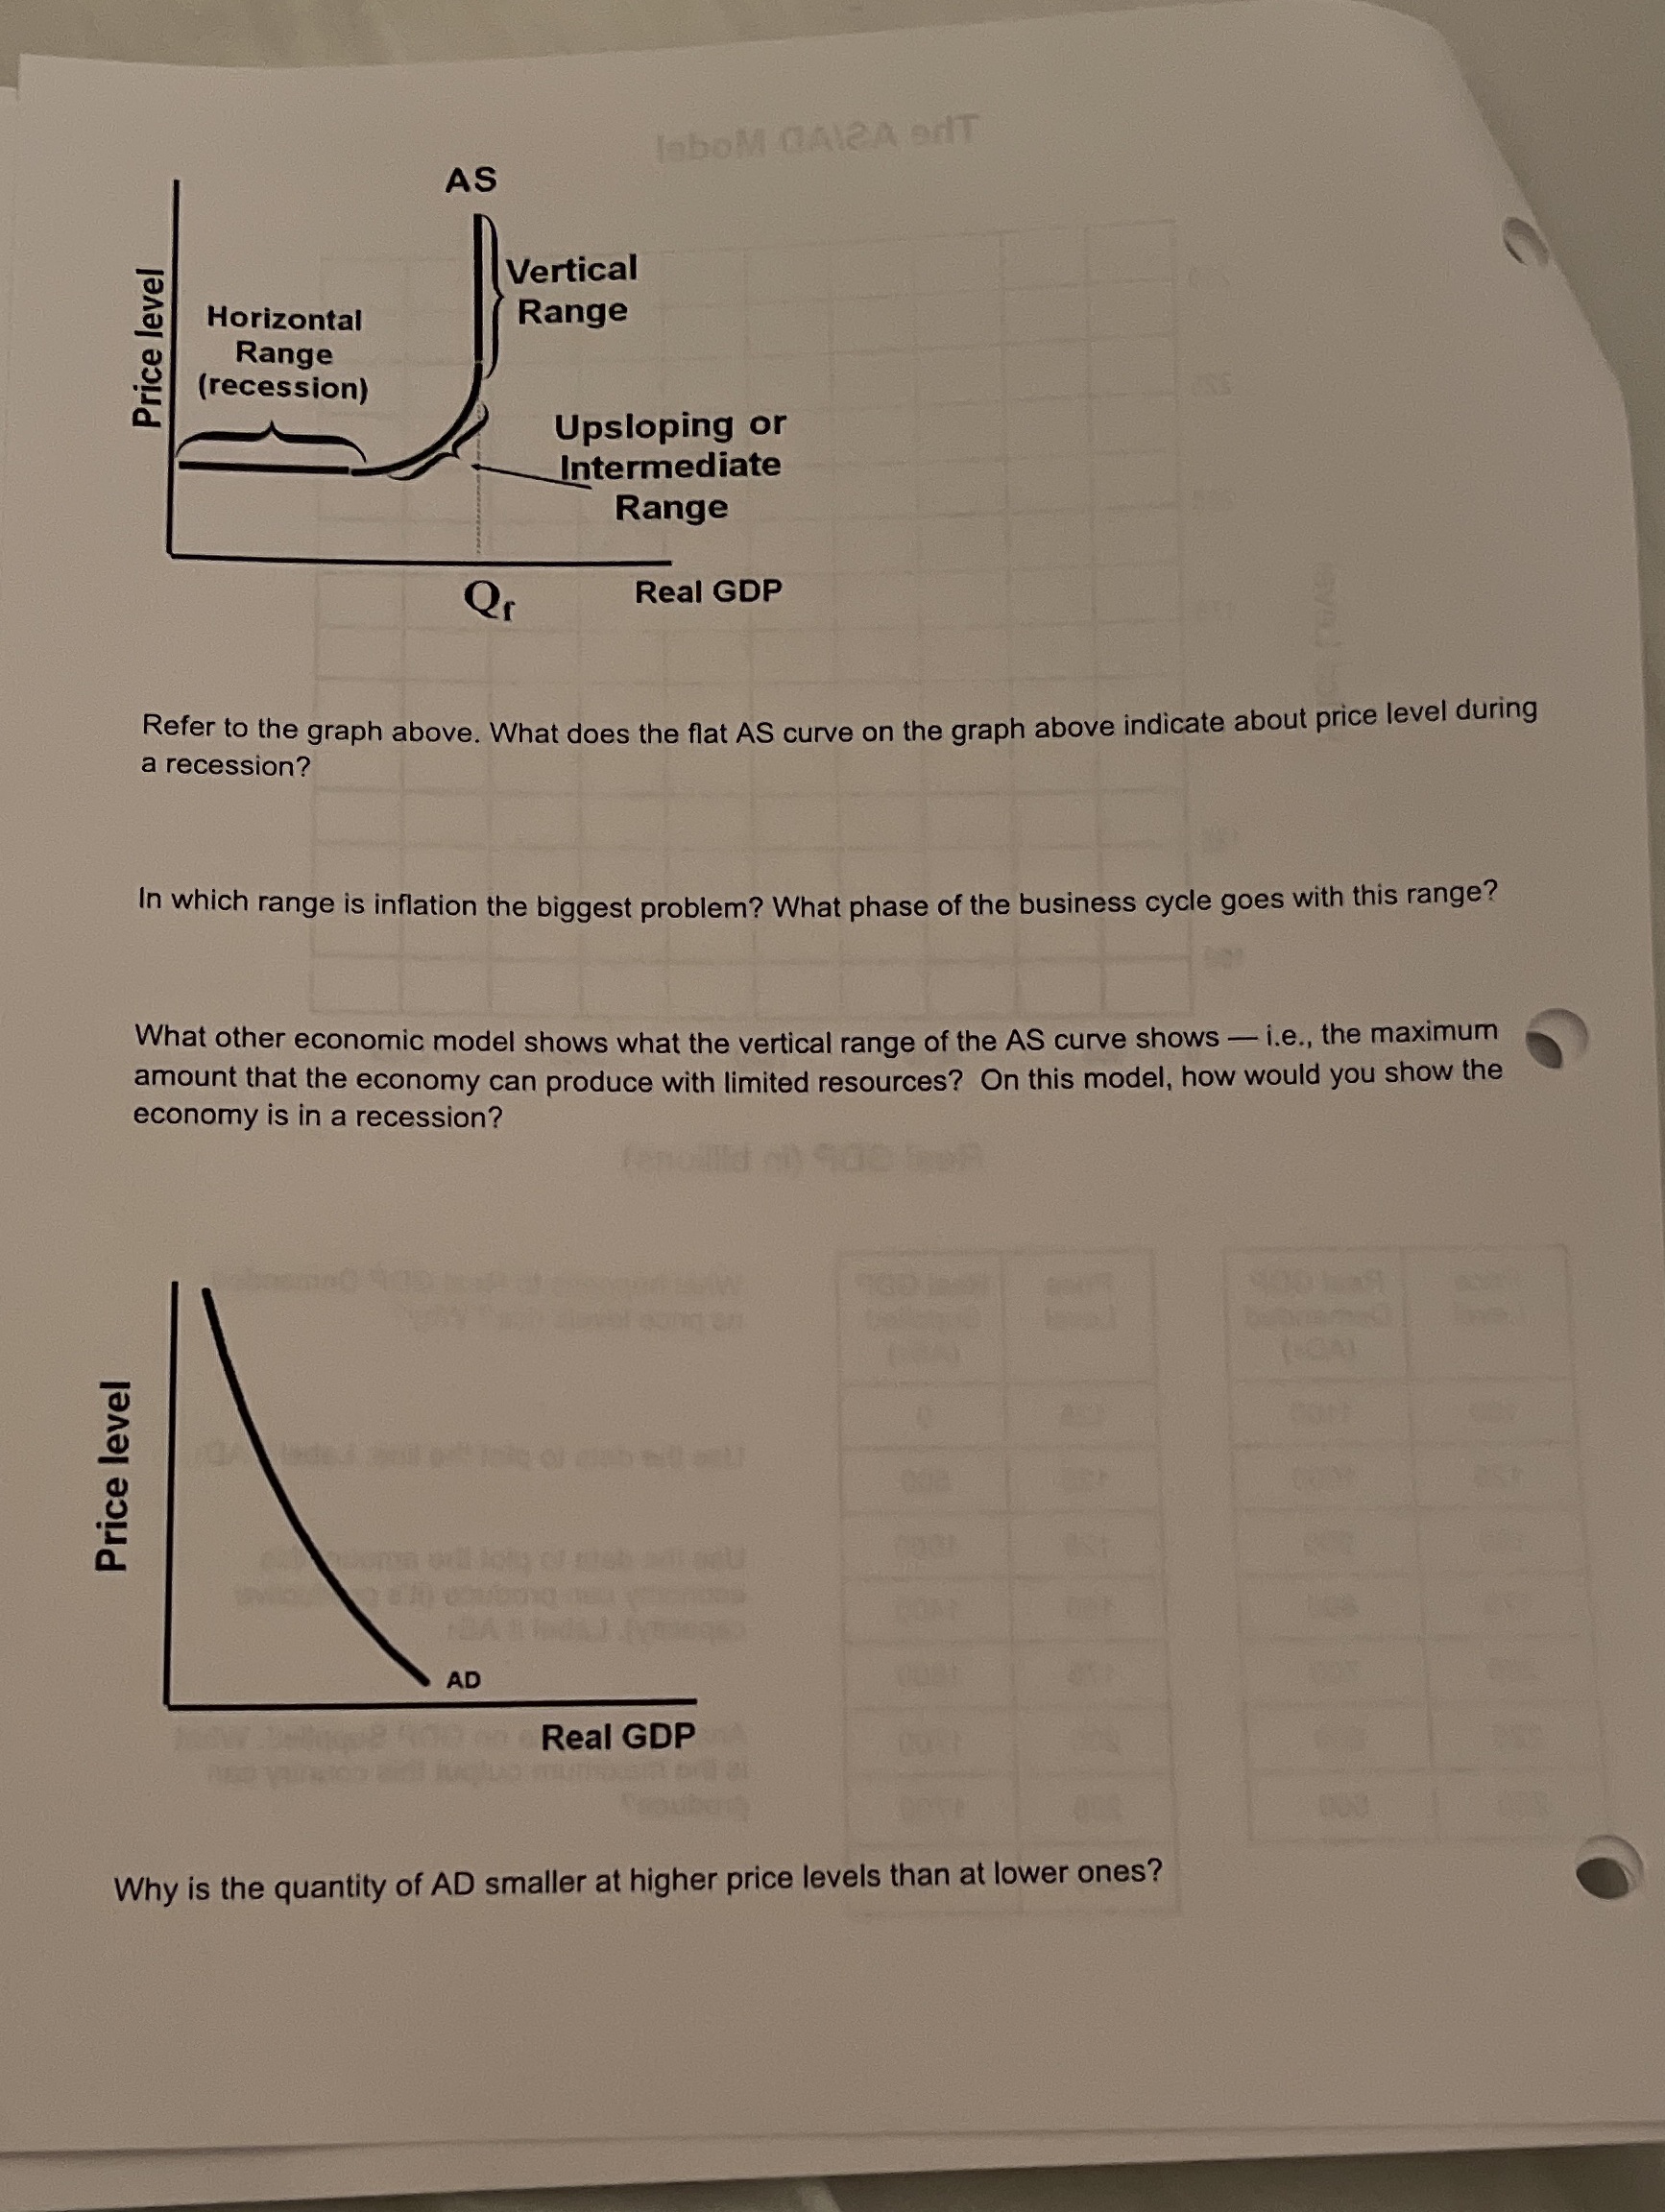
laboM QAlex andT AS Vertical Horizontal Range Price level Range (recession) Upsloping or Intermediate Range Qr Real GDP Refer to the graph above. What does the flat AS curve on the graph above indicate about price level during a recession? In which range is inflation the biggest problem? What phase of the business cycle goes with this range? What other economic model shows what the vertical range of the AS curve shows - i.e., the maximum amount that the economy can produce with limited resources? On this model, how would you show the economy is in a recession? Price level AD Real GDP Why is the quantity of AD smaller at higher price levels than at lower ones
Step by Step Solution
There are 3 Steps involved in it

Get step-by-step solutions from verified subject matter experts