

Question: LABORATORY ASSIGNMENT 9: POLYNOMIAL REGRESSION AND INTEGRATION IN MATLAB Objective In this lab you will practice how to determine a best least squares regression fit
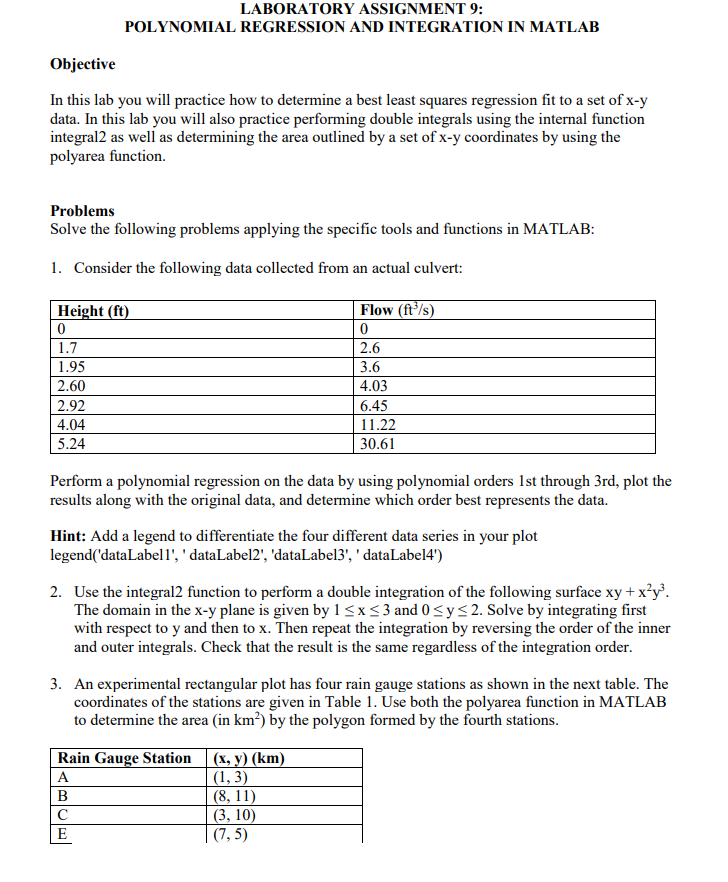
LABORATORY ASSIGNMENT 9: POLYNOMIAL REGRESSION AND INTEGRATION IN MATLAB Objective In this lab you will practice how to determine a best least squares regression fit to a set of x-y data. In this lab you will also practice performing double integrals using the internal function integral2 as well as determining the area outlined by a set of x-y coordinates by using the polyarea function. Problems Solve the following problems applying the specific tools and functions in MATLAB 1. Consider the following data collected from an actual culvert: Height (ft) 1.95 2.60 2.92 4.04 5.24 Flow (ftls 0 2.6 3.6 4.03 6.45 11.22 30.61 Perform a polynomial regression on the data by using polynomial orders 1st through 3rd, plot the results along with the original data, and determine which order best represents the data. Hint: Add a legend to differentiate the four different data series in your plot legend(dataLabel', dataLabel2', 'dataLabel3', ' dataLabel4') 2. Use the integral2 function to perform a double integration of the following surface xy +x'y. The domain in the x-y plane is given by 1 x 3 and 0 Sy s 2. Solve by integrating first with respect to y and then to x. Then repeat the integration by reversing the order of the inner and outer integrals. Check that the result is the same regardless of the integration order 3. An experimental rectangular plot has four rain gauge stations as shown in the next table. The coordinates of the stations are given in Table 1. Use both the polyarea function in MATLAB to determine the area (in km2) by the polygon formed by the fourth stations Rain Gauge Station | (x, y) (km 8, 11 3, 10 (7, 5) LABORATORY ASSIGNMENT 9: POLYNOMIAL REGRESSION AND INTEGRATION IN MATLAB Objective In this lab you will practice how to determine a best least squares regression fit to a set of x-y data. In this lab you will also practice performing double integrals using the internal function integral2 as well as determining the area outlined by a set of x-y coordinates by using the polyarea function. Problems Solve the following problems applying the specific tools and functions in MATLAB 1. Consider the following data collected from an actual culvert: Height (ft) 1.95 2.60 2.92 4.04 5.24 Flow (ftls 0 2.6 3.6 4.03 6.45 11.22 30.61 Perform a polynomial regression on the data by using polynomial orders 1st through 3rd, plot the results along with the original data, and determine which order best represents the data. Hint: Add a legend to differentiate the four different data series in your plot legend(dataLabel', dataLabel2', 'dataLabel3', ' dataLabel4') 2. Use the integral2 function to perform a double integration of the following surface xy +x'y. The domain in the x-y plane is given by 1 x 3 and 0 Sy s 2. Solve by integrating first with respect to y and then to x. Then repeat the integration by reversing the order of the inner and outer integrals. Check that the result is the same regardless of the integration order 3. An experimental rectangular plot has four rain gauge stations as shown in the next table. The coordinates of the stations are given in Table 1. Use both the polyarea function in MATLAB to determine the area (in km2) by the polygon formed by the fourth stations Rain Gauge Station | (x, y) (km 8, 11 3, 10 (7, 5)
Step by Step Solution
There are 3 Steps involved in it

Get step-by-step solutions from verified subject matter experts