

Question: language is python 5. Uber Below we load tables containing 200,000 weekday Uber rides in the Manila, Philippines, and Boston, Massachusetts metropolitan areas from the
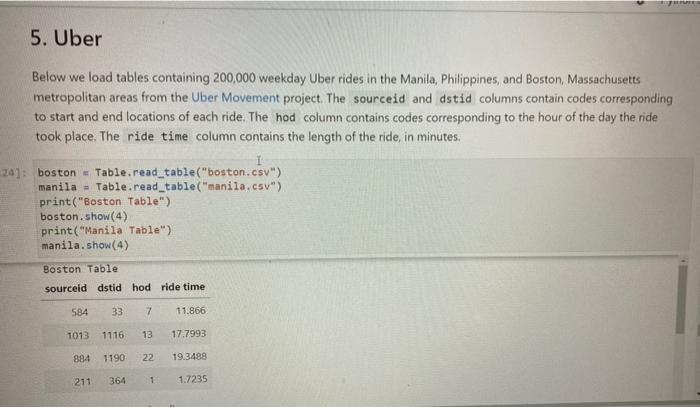
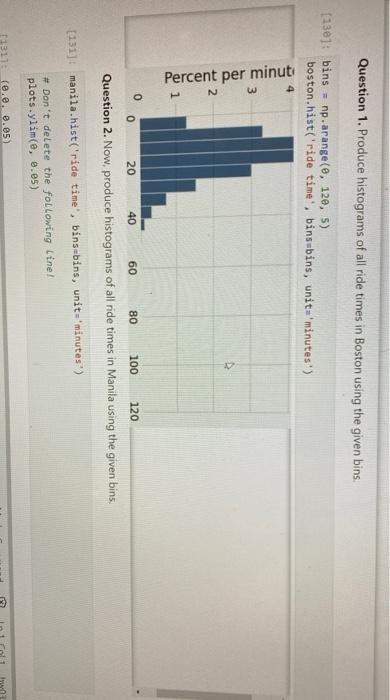
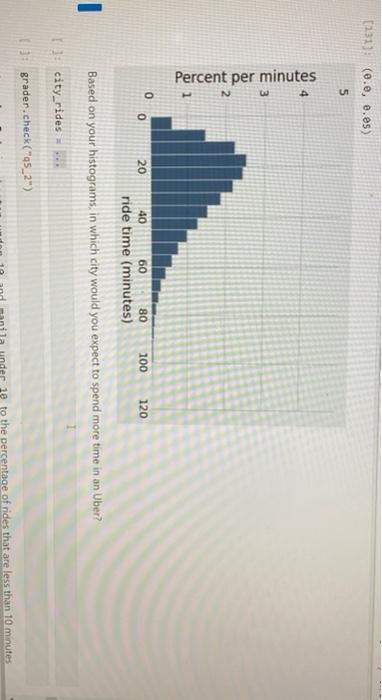
5. Uber Below we load tables containing 200,000 weekday Uber rides in the Manila, Philippines, and Boston, Massachusetts metropolitan areas from the Uber Movement project. The sourceid and dstid columns contain codes corresponding to start and end locations of each ride. The hod column contains codes corresponding to the hour of the day the ride took place. The ride time column contains the length of the ride, in minutes. 24]: boston = Table.read_table("boston.csv") manila - Table.read_table("manila.csv") print("Boston Table") boston.show(4) print("Manila Table") manila.show(4) Boston Table sourceid dstid hod ride time 584 33 7 11.866 1013 1116 13 17.7993 884 1190 22 19.3488 211 364 1 1.7235 Question 1. Produce histograms of all ride times in Boston using the given bins. (130): bins = np.arange(0, 120, 5) boston.hist('ride time', binsbins, unit='minutes) 3 Percent per minut A 2 40 0 0 20 60 80 100 120 Question 2. Now, produce histograms of all ride times in Manila using the given bins. [131]: manila.hist('ride time', bins-bins, unit-minutes) # Don't delete the following line! plots.ylim(e, 0.05) 11311 (0.0, 0.05) (131): (e.e, 0.05) 5 Percent per minutes 2 0 0 20 40 80 100 120 60 ride time (minutes) Based on your histograms, in which city would you expect to spend more time in an Uber? city_rides 3 grader.check("95_2") ne to the percentage of rides that are less than 10 minutes
Step by Step Solution
There are 3 Steps involved in it

Get step-by-step solutions from verified subject matter experts