

Question: LANGUAGE: MATLAB( PLEASE PROVIDE THE CODE WITH GRAPHS) Plot the functions y=x, y=x2, y=ex and y=ex*x over the interval 0
LANGUAGE: MATLAB( PLEASE PROVIDE THE CODE WITH GRAPHS)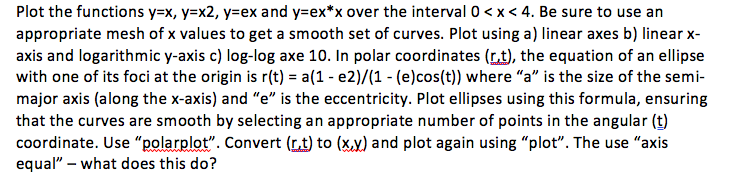
Plot the functions y=x, y=x2, y=ex and y=ex*x over the interval 0
Step by Step Solution
There are 3 Steps involved in it
1 Expert Approved Answer
Step: 1 Unlock

Question Has Been Solved by an Expert!
Get step-by-step solutions from verified subject matter experts
Step: 2 Unlock
Step: 3 Unlock