

Question: Lapter 4 Assignment 4. Changes in the equilibrium exchange rate The following graph depicts the foreign exchange market for euros. The blue line represents the
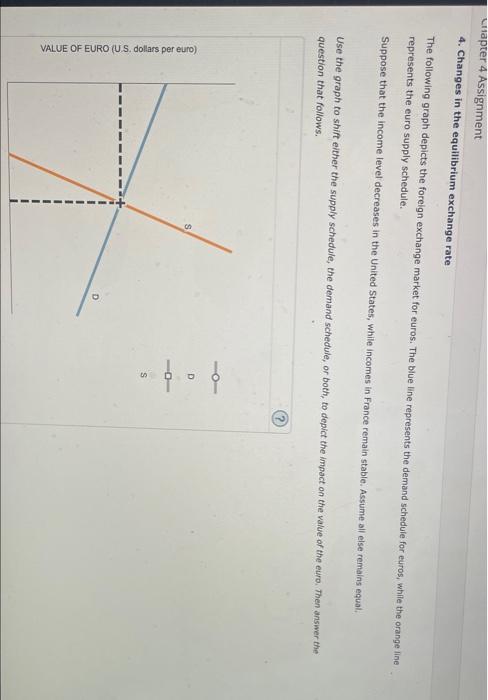
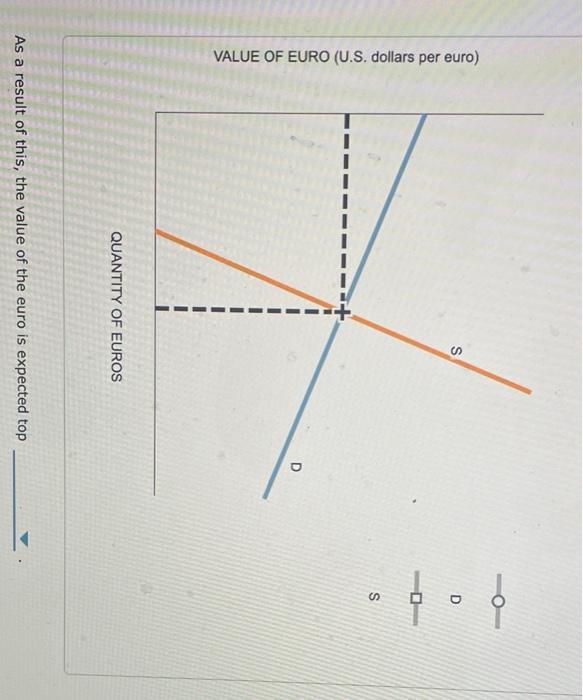
Lapter 4 Assignment 4. Changes in the equilibrium exchange rate The following graph depicts the foreign exchange market for euros. The blue line represents the demand schedule for euros, while the orange line represents the euro supply schedule. Suppose that the income level decreases in the United States, while incomes in France remain stable. Assume all else remains equal. Use the graph to shift either the supply schedule, the demand schedule, or both, to depict the impact on the value of the euro. Then answer the question that follows. $ - D - VALUE OF EURO (U.S. dollars per euro) S VALUE OF EURO (U.S. dollars per euro) D QUANTITY OF EUROS As a result of this, the value of the euro is expected top
Step by Step Solution
There are 3 Steps involved in it

Get step-by-step solutions from verified subject matter experts