

Question: Last semester, students in a statistics class at LMC collected random samples of M&Ms candy and counted the proportion of blue M&Ms in each sample,
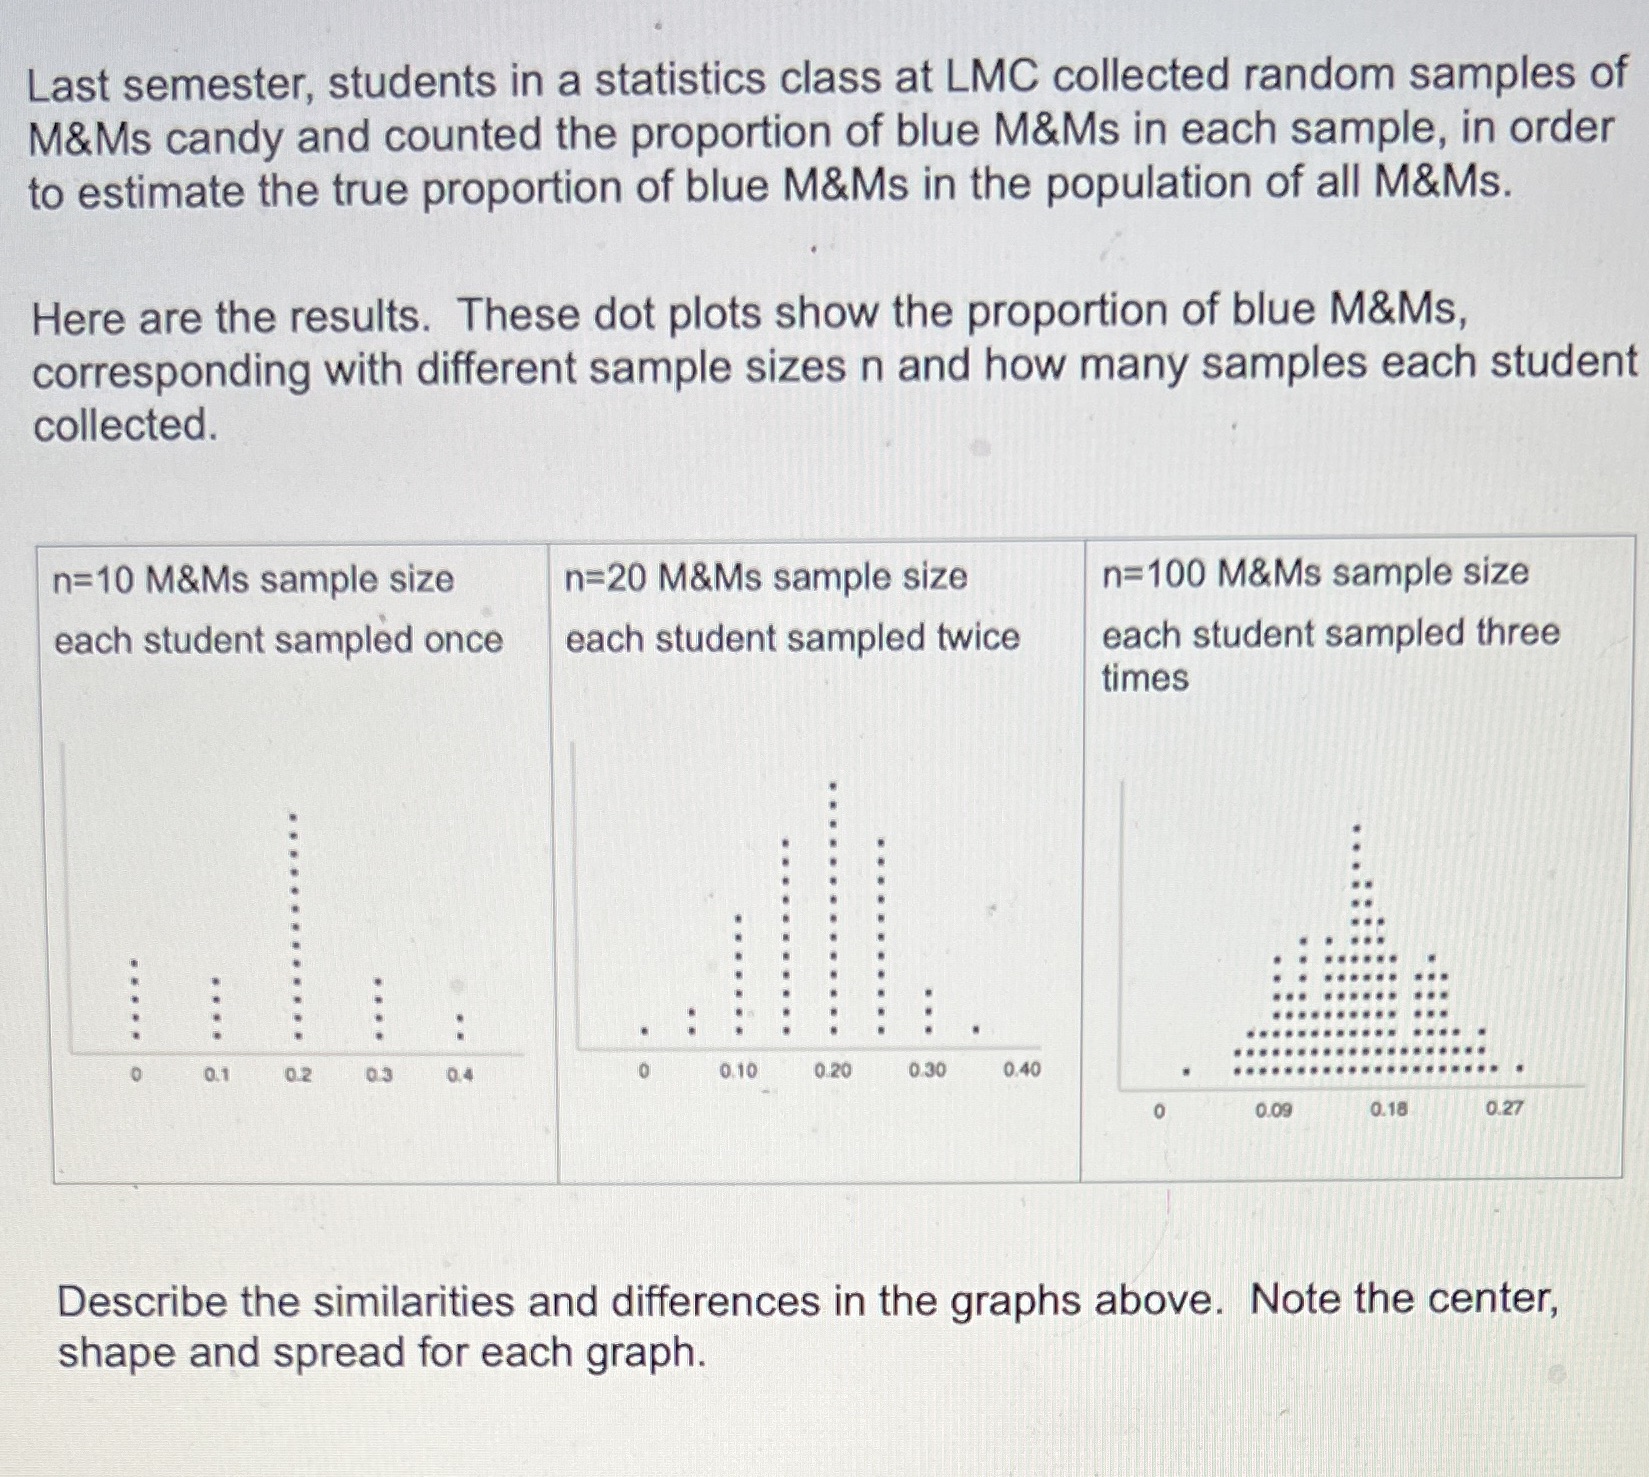
Last semester, students in a statistics class at LMC collected random samples of M&Ms candy and counted the proportion of blue M&Ms in each sample, in order to estimate the true proportion of blue M&Ms in the population of all M&Ms. Here are the results. These dot plots show the proportion of blue M&Ms, corresponding with different sample sizes n and how many samples each student collected. n=10 M&Ms sample size n=20 M&Ms sample size n=100 M&Ms sample size each student sampled once each student sampled twice each student sampled three times III........ ........ .5..... . . . . 0.2 0.3 0.10 0.20 0.30 0.40 0.09 0.18 0.27 Describe the similarities and differences in the graphs above. Note the center, shape and spread for each graph
Step by Step Solution
There are 3 Steps involved in it

Get step-by-step solutions from verified subject matter experts