

Question: late data sets and their scatter plots. (Note that all of the scatter plots are displayed with the same scale. ) Each data set is
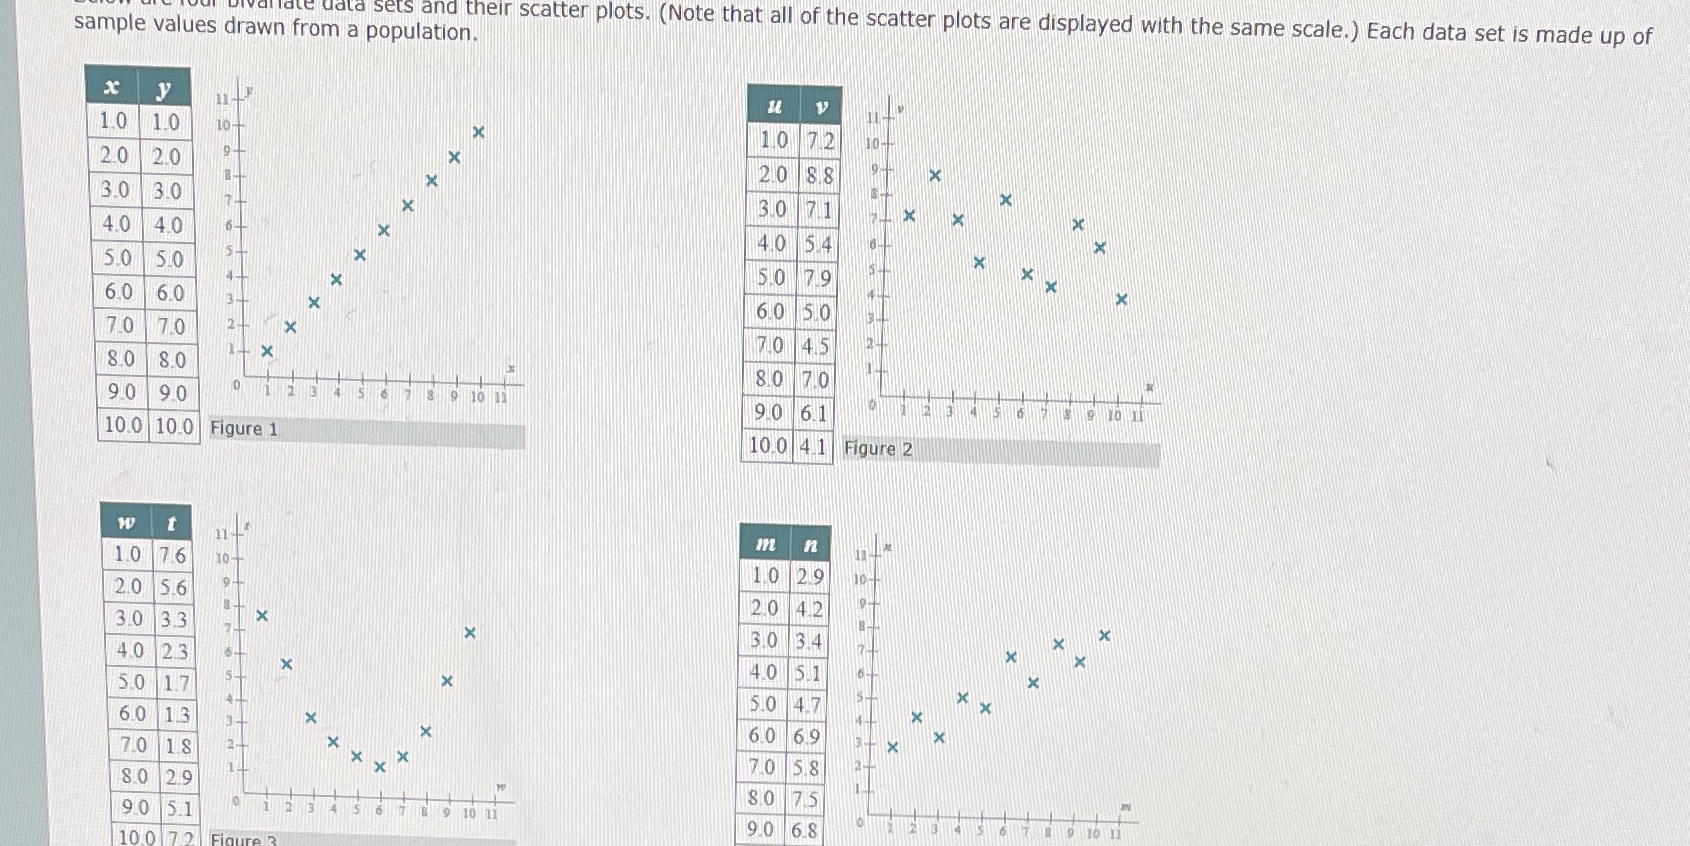
late data sets and their scatter plots. (Note that all of the scatter plots are displayed with the same scale. ) Each data set is made up of sample values drawn from a population. X y V 10 10 10- 10 72 10- 20 20 20 8 8 X 3.0 30 i X 30 71 4.0 4.0 X 40 5.4 X X 5.0 50 50 79 60 6.0 60 50 70 70 X 70 45 X 80 80 80 70 90 90 5 6 7 3 9 10 11 90 61 10 0 10 0 Figure 1 10.0 41 Figure 2 t IPE n 10 76 10 10 29 10 20 56 20 42 30 33 X X 3.0 3.4 X 40 23 X 40 51 50 17 X 50 14.7 XI 60 13 X 60 69 X 70 18 X X X 7.0 5.8 80 29 80 75 90 5.1 2 3 10 11 90 68 16 17 10 0 72
Step by Step Solution
There are 3 Steps involved in it
1 Expert Approved Answer
Step: 1 Unlock

Question Has Been Solved by an Expert!
Get step-by-step solutions from verified subject matter experts
Step: 2 Unlock
Step: 3 Unlock