

Question: later tonight. CENGAGE | MINDTAP Chapter 13: Graded Homework Fill in the remaining cells of the following table. Quantity Total Cost Marginal Cost Fixed Cost
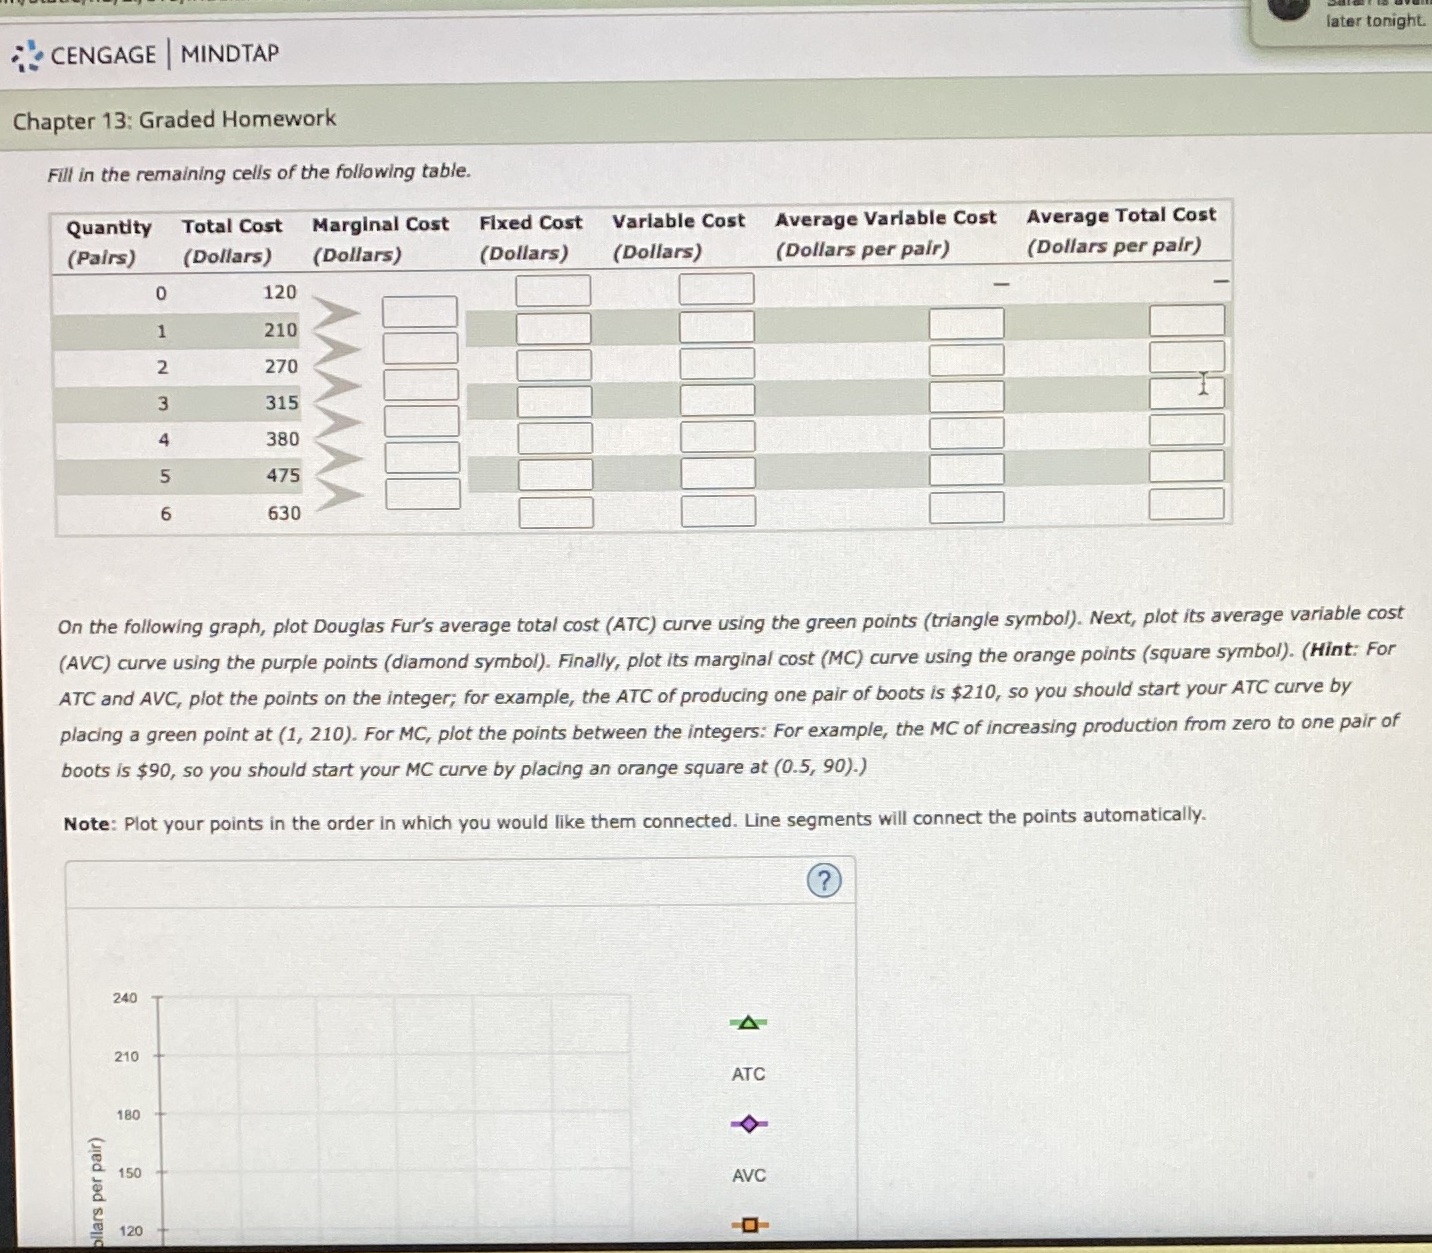
later tonight. CENGAGE | MINDTAP Chapter 13: Graded Homework Fill in the remaining cells of the following table. Quantity Total Cost Marginal Cost Fixed Cost Variable Cost Average Variable Cost Average Total Cost (Pairs) (Dollars) (Dollars) (Dollars) (Dollars) (Dollars per pair) (Dollars per pair) 120 210 270 W 315 4 380 475 6 630 On the following graph, plot Douglas Fur's average total cost (ATC) curve using the green points (triangle symbol). Next, plot its average variable cost (AVC) curve using the purple points (diamond symbol). Finally, plot its marginal cost (MC) curve using the orange points (square symbol). (Hint: For ATC and AVC, plot the points on the integer; for example, the ATC of producing one pair of boots is $210, so you should start your ATC curve by placing a green point at (1, 210). For MC, plot the points between the integers: For example, the MC of increasing production from zero to one pair of boots is $90, so you should start your MC curve by placing an orange square at (0.5, 90).) Note: Plot your points in the order in which you would like them connected. Line segments will connect the points automatically. (?) 240 4 210 ATC 180 150 AVC llars per pair) 120
Step by Step Solution
There are 3 Steps involved in it

Get step-by-step solutions from verified subject matter experts