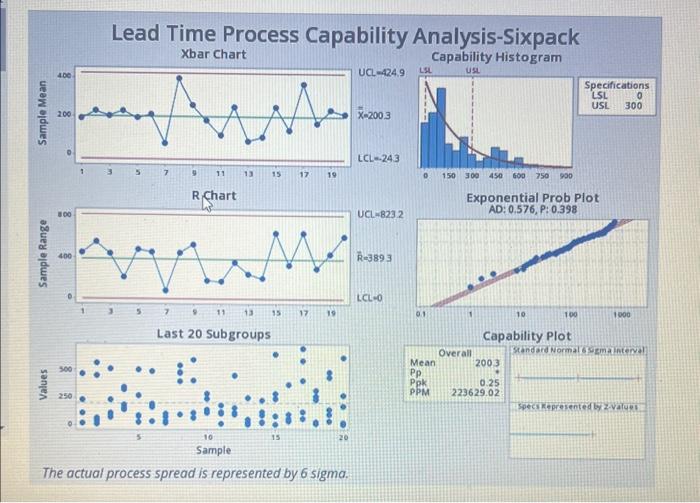
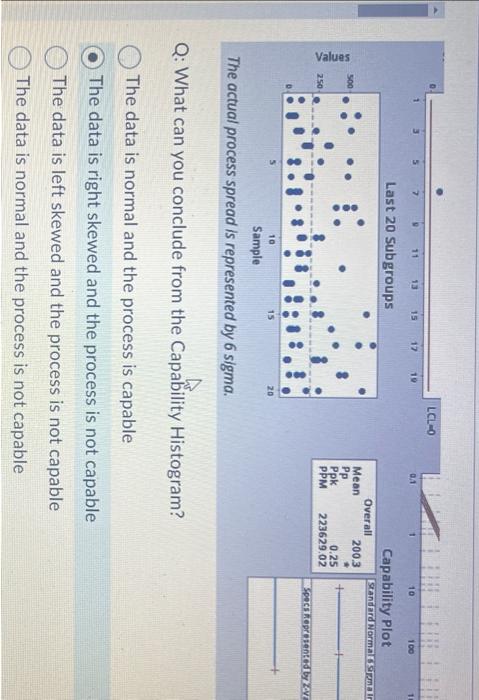
Question: Lead Time Process Capability Analysis-Sixpack Xbar Chart Capability Histogram UCL 8232 Exponential Prob Plot AD: 0.576, P: 0.398 The actual process spread is represented by

Lead Time Process Capability Analysis-Sixpack
Lead Time Process Capability Analysis-Sixpack Xbar Chart Capability Histogram UCL 8232 Exponential Prob Plot AD: 0.576, P: 0.398 The actual process spread is represented by 6 sigma. Q: What can you conclude from the Capability Histogram? The data is normal and the process is capable The data is right skewed and the process is not capable The data is left skewed and the process is not capable The data is normal and the process is not capable

Step by Step Solution

There are 3 Steps involved in it

1 Expert Approved Answer
Step: 1 Unlock blur-text-image
Question Has Been Solved by an Expert!

Get step-by-step solutions from verified subject matter experts

Step: 2 Unlock
Step: 3 Unlock

Students Have Also Explored These Related General Management Questions!