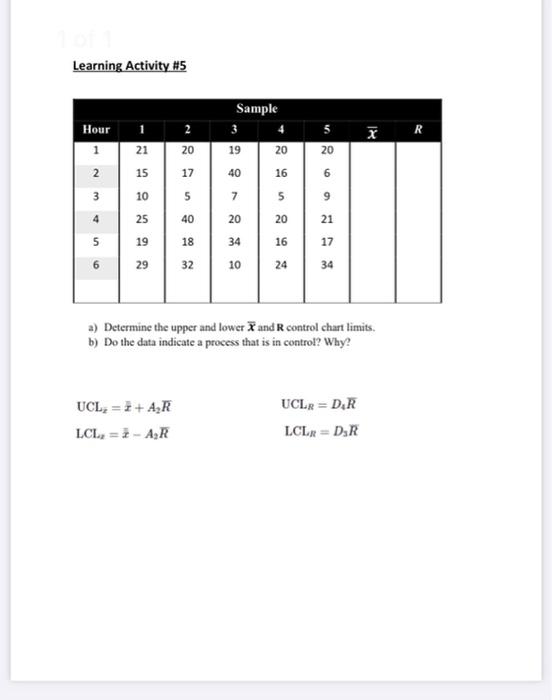
Question: Learning Activity #5 Sample 2 Hour 1 x R 21 20 19 20 20 2 15 17 40 16 6 3 10 5 7 9

Learning Activity #5 Sample 2 Hour 1 x R 21 20 19
Learning Activity #5 Sample 2 Hour 1 x R 21 20 19 20 20 2 15 17 40 16 6 3 10 5 7 9 5 20 4 25 40 20 21 19 18 34 16 17 29 32 10 24 34 a) Determine the upper and lower X and control chart limits. b) Do the data indicate a process that is in control? Why? UCL, = * + AR LCL, = - AR UCLR=D.R LCLR=DER

Step by Step Solution

There are 3 Steps involved in it

1 Expert Approved Answer
Step: 1 Unlock blur-text-image
Question Has Been Solved by an Expert!

Get step-by-step solutions from verified subject matter experts

Step: 2 Unlock
Step: 3 Unlock

Students Have Also Explored These Related General Management Questions!