

Question: Learning Goal: For the distribution of a quantitative variable, describe the overall pattern (shape, center, and spread) and striking deviations from the pattern. Specific Learning
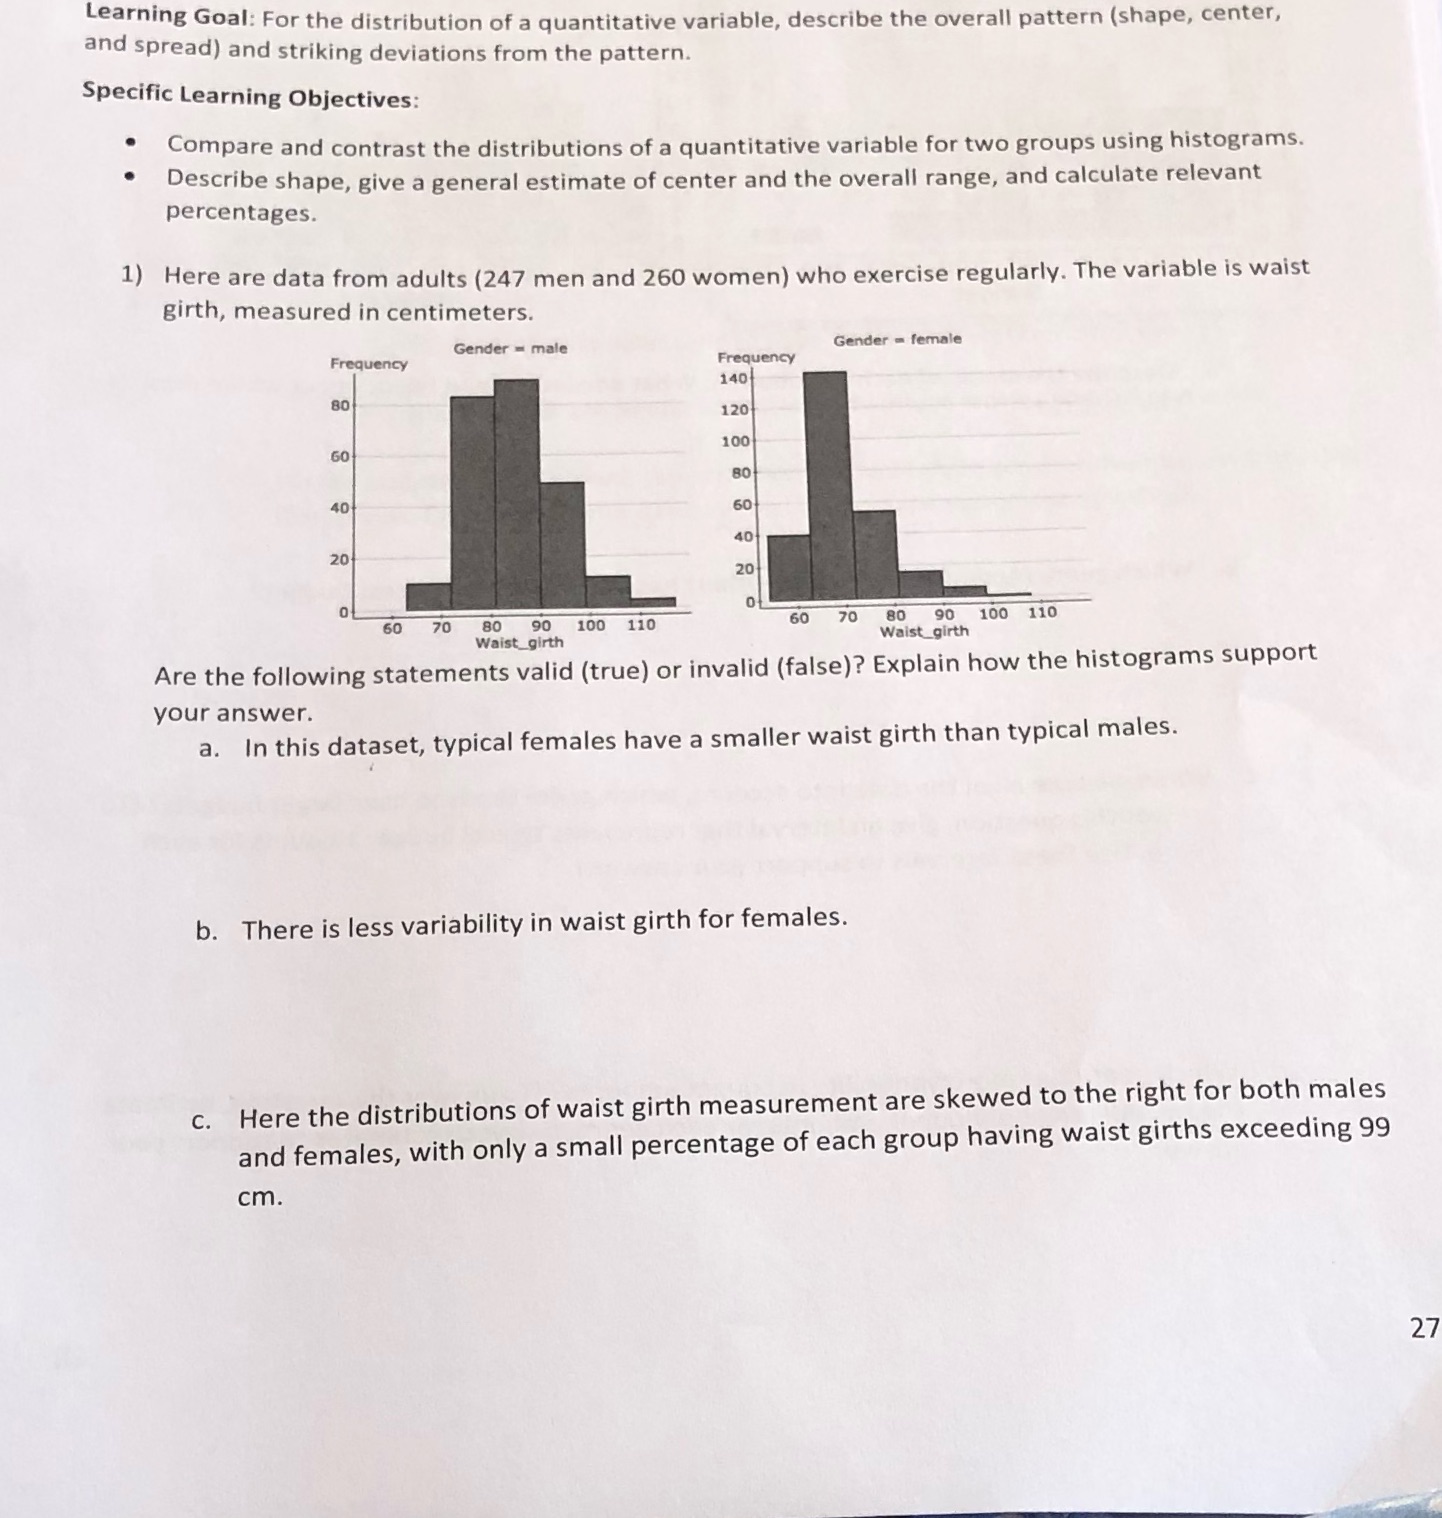
Learning Goal: For the distribution of a quantitative variable, describe the overall pattern (shape, center, and spread) and striking deviations from the pattern. Specific Learning Objectives: Compare and contrast the distributions of a quantitative variable for two groups using histograms. Describe shape, give a general estimate of center and the overall range, and calculate relevant percentages. 1) Here are data from adults (247 men and 260 women) who exercise regularly. The variable is waist girth, measured in centimeters. Gender - female Frequency Gender = male Frequency 140 120 100 60 40 60 40 20 20 60 70 80 90 100 110 60 90 100 110 Waist_girth Waist_girth Are the following statements valid (true) or invalid (false)? Explain how the histograms support your answer. a. In this dataset, typical females have a smaller waist girth than typical males. b. There is less variability in waist girth for females. c. Here the distributions of waist girth measurement are skewed to the right for both males and females, with only a small percentage of each group having waist girths exceeding 99 cm 27
Step by Step Solution
There are 3 Steps involved in it

Get step-by-step solutions from verified subject matter experts