

Question: LEARNING OBJECTIVE: Identify misleading graphics In a bar graph. The bar graph below shows me net sales of a magazine company over the years y
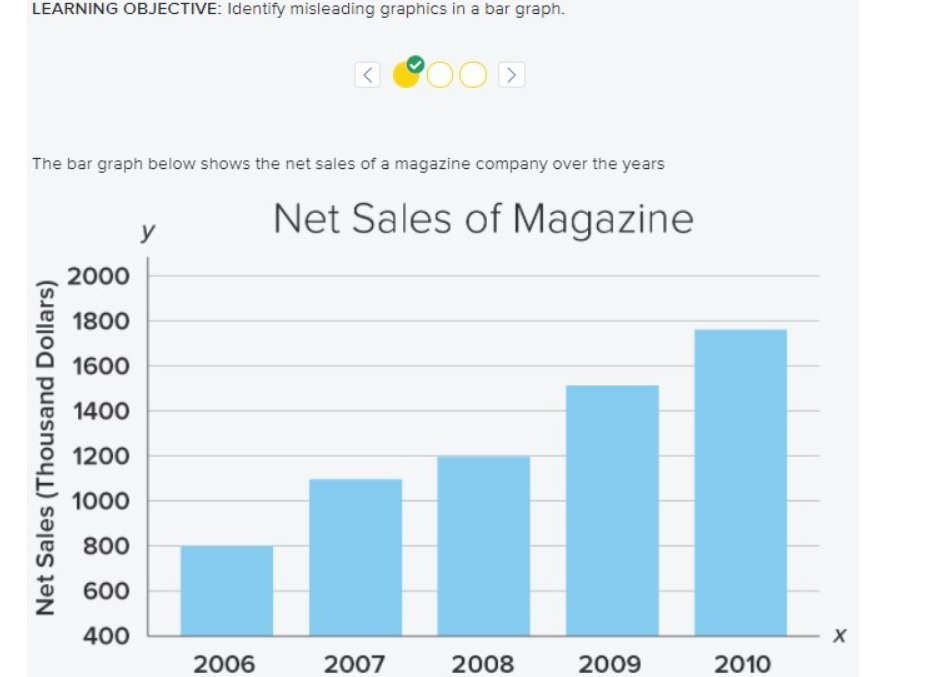
LEARNING OBJECTIVE: Identify misleading graphics In a bar graph. The bar graph below shows me net sales of a magazine company over the years y Net Sales of Magazine 3 33 Net Sales [Thousand Dollars) "' 8 2006 2007 2008 2009 2010
Step by Step Solution
There are 3 Steps involved in it
1 Expert Approved Answer
Step: 1 Unlock

Question Has Been Solved by an Expert!
Get step-by-step solutions from verified subject matter experts
Step: 2 Unlock
Step: 3 Unlock