Question: Learning Objectives 1. Prepare common size Income Statement in Excel 2. Prepare common size Balance Sheet in Excel 3. Use appropriate formulas and cell referencing

Learning Objectives 1. Prepare common size Income Statement in Excel 2. Prepare common size Balance Sheet in Excel 3. Use appropriate formulas and cell referencing to create common size financial statements 4. Apply appropriate numeric format on Excel spread 5. Analyze and interpret outcome of financial statement ratios.

Data Set Background

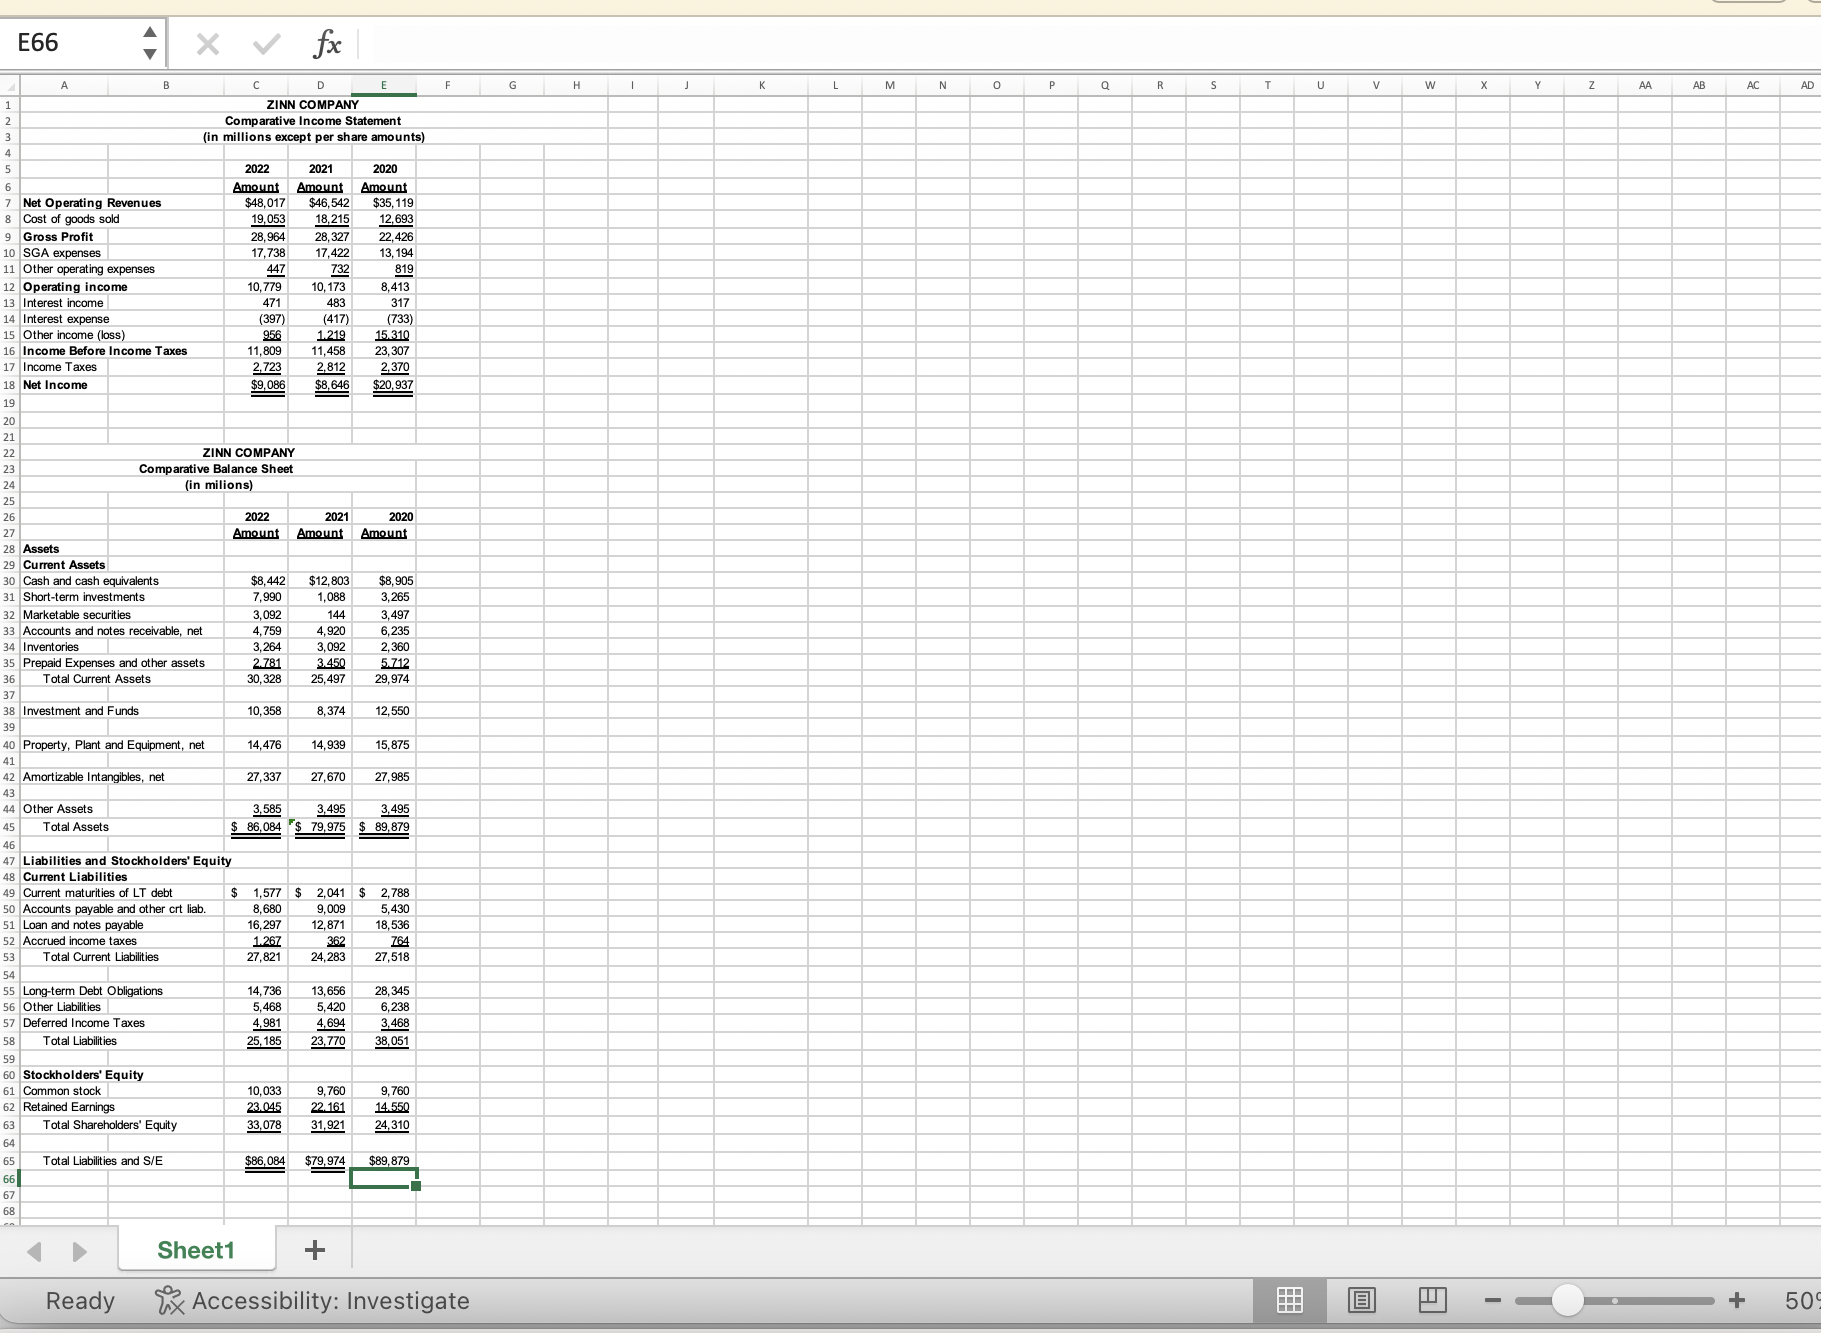
As an analyst you are asked to conduct a financial statement analysis and risk analysis of a company. The data set contains the Income Statement and Balance Sheet of Zinn, Inc. for years 2020 through 2022.

Required:

1. Prepare a common size Income Statement and common size Balance Sheet for the years 2022 and 2021on a separate worksheet. Label the worksheet 'ComSizeFS'. You should apply appropriate formulas for the percentages, subtotals, and totals with the proper cell referencing. Percentages should be rounded to 2 decimal places.

2. Calculate the following financial statement ratios for the years 2022 and 2021 on a separate worksheet. Label the worksheet 'FinStRatios'. You should apply appropriate formulas to calculate the ratios with the proper cell referencing. Ratios and percentages should be rounded to 2 decimal places. The financial statement ratios to be calculated are:

a. Liquidity Ratios - Current ratio and Quick ratio (see Chapter 3)

b. Solvency Ratios - Debt to equity and Times interest earned

c. Activity Ratios - Asset turnover, Receivables turnover, and Inventory turnover

d. Profitability Ratios - Profit margin on sales, Return on assets, and Return on equity

e. Leverage Ratio - Equity multiplier

3. Based on your financial statement analysis, what trends do note from 2021 to 2022 and what does this suggest about the company's liquidity, profitability, and solvency? Place your summation in the row below the financial statement ratios on the FinStRatios worksheet.

4. Format worksheet with font style Times New Roman, font size 12, and appropriate numeric formatting.

Learning Objectives 1. Prepare common size Income
E66 X V fx G AA AB AC ZINN COMPANY Comparative Income Statement (in millions except per share amounts) 2022 2021 2020 mount Amount Amount Net Operating Revenues $48,017 $46,542 $35, 119 Cost of goods sold 19,053 18,215 12,693 Gross Profit 28,964 28, 327 22.426 10 SGA expenses 17,738 17. 422 13, 194 11 Other operating expenses 447 732 819 12 Operating income 10,779 10, 173 8,413 3 Interest income 471 483 317 14 Interest expense (397) (417) ( 733 ) 15 Other income (loss) 956 1.219 15.310 16 Income Before Income Taxes 11,809 11,458 23, 307 17 Income Taxes 2,723 2,812 2,370 18 Net Income $9,086 $8,646 $20,937 19 20 21 22 ZINN COMPANY Comparative Balance Sheet (in milions) 2022 2021 2020 Amount Amount Amount 28 Assets 29 Current Assets Cash and cash equivalents $8,442 $12, 803 $8,905 31 Short-term investments 7,990 1088 3,265 32 Marketable securities 3,092 144 3,497 33 Accounts and notes receivable, net 4,759 .920 6,235 34 Inventories 3.264 3.092 2,360 35 Prepaid Expenses and other assets 2.781 3.450 5.712 Total Current Assets 30. 328 25. 49 29.974 37 Investment and Funds 10,358 8,374 12,550 40 Property, Plant and Equipment, net 14,476 14,939 15,875 2 Amortizable Intangibles, net 27,337 27,670 27,98 43 14 Other Assets 3,585 3,495 3,495 Total Assets $ 86,084 $ 79.975 $ 89,879 17 Liabilities and Stockholders' Equity 48 Current Liabilities 49 Current maturities of LT debt $ 1,577 $ 2,041 $ 2,78 50 Accounts payable and other crt liab. 8,680 9,009 5,430 51 Loan and notes payable 16,297 2,871 18.536 52 Accrued income taxes 1.267 362 764 Total Current Liabilities 27,821 24,283 27,518 55 Long-term Debt Obligations 14,736 13,656 28,345 56 Other Liabilities 5,468 5,420 6,238 57 Deferred Income Taxes 4.981 4,694 3,468 Total Liabilities 25, 185 23,770 38,051 0 Stockholders' Equity 61 Common stock 10,033 9,760 9,760 62 Retained Earnings 23 045 22.161 14.550 63 Total Shareholders' Equity 33, 078 31,921 24,310 64 Total Liabilities and S/E $86, 084 $79,974 $89,879 Sheet1 + Ready Accessibility: Investigate + 50

Step by Step Solution

There are 3 Steps involved in it

1 Expert Approved Answer
Step: 1 Unlock blur-text-image
Question Has Been Solved by an Expert!

Get step-by-step solutions from verified subject matter experts

Step: 2 Unlock
Step: 3 Unlock

Students Have Also Explored These Related Finance Questions!