

Question: Learning Objectives: For the Session 04 Prelab Exercise you must successfully master the following tasks in Excel: 1. Perform a statistical and simple linear regression
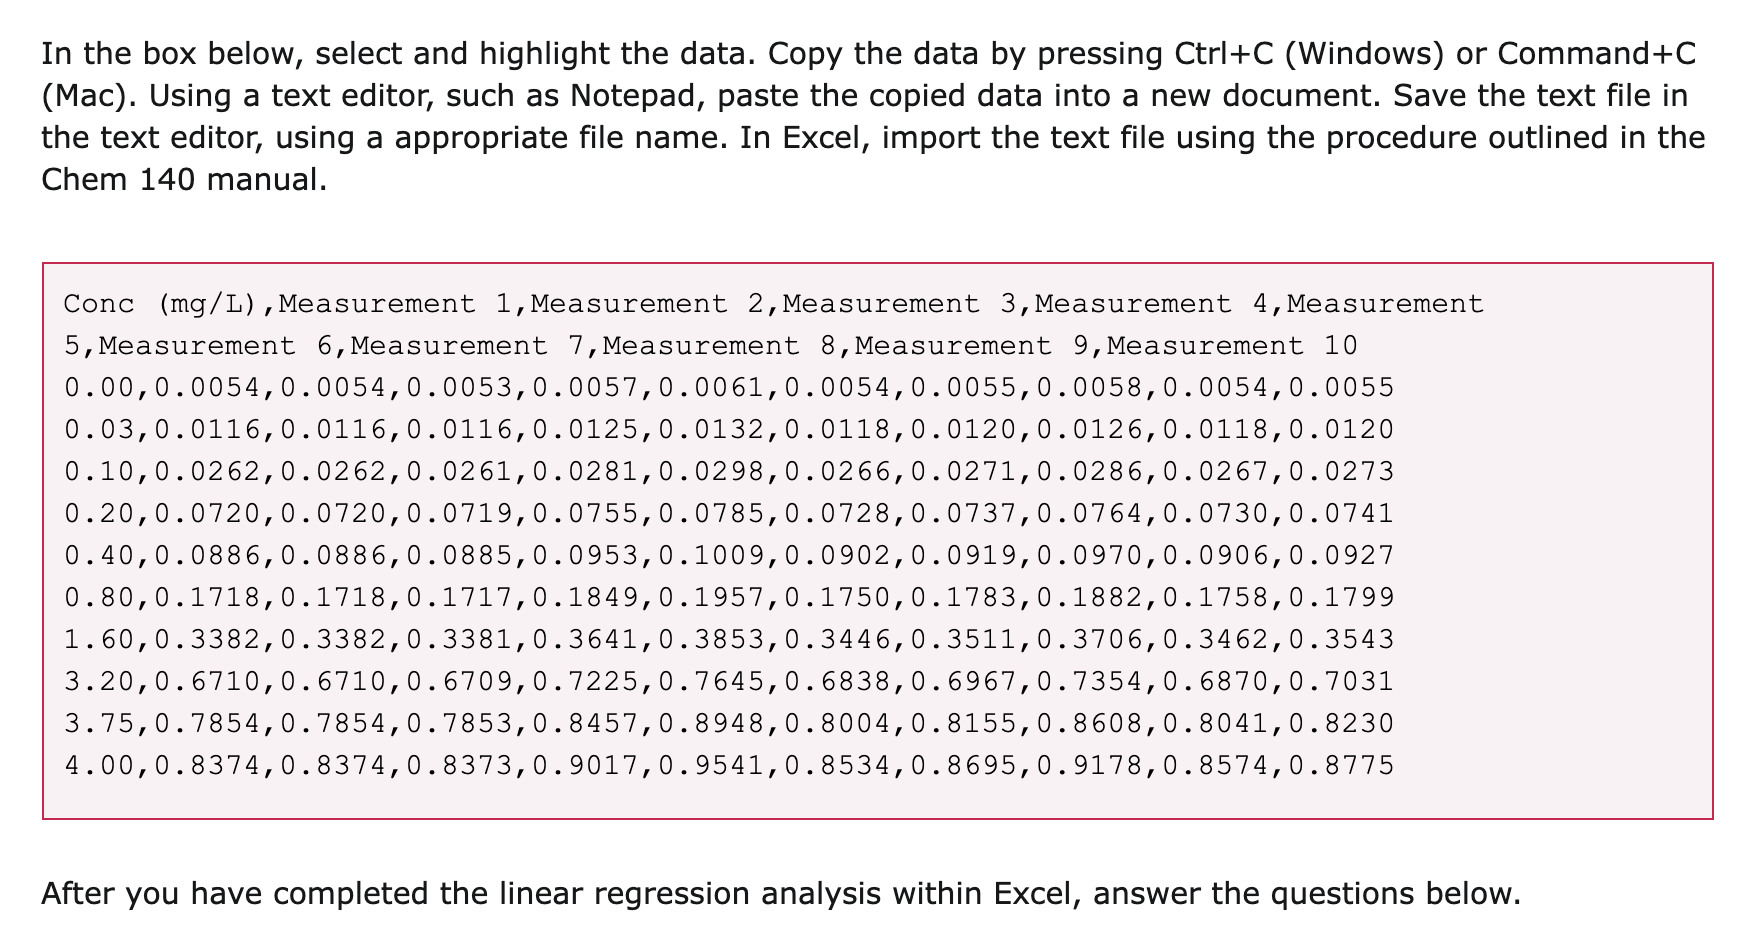
Learning Objectives: For the Session 04 Prelab Exercise you must successfully master the following tasks in Excel: 1. Perform a statistical and simple linear regression analysis on a set of experimental calibration data. 2. Create and use a calibration plot to determine the concentration of an unknown standard. For this Pre-lab Exercise, you will be provided with a set of experimental calibration data. A series of standards were prepared, with known concentrations of ammonia (NH3). The standards were introduced to an instrument that measured ammonia content. Each of the standards were measured and a signal reading was recorded. For each standard, several repeat measurements were made. The experimental calibration data is provided on the next page. In the box below, select and highlight the data. Copy the data by pressing Ctrl+C (Windows) or Command+C (Mac). Using a text editor, such as Notepad, paste the copied data into a new document. Save the text file in the text editor, using a appropriate file name. In Excel, import the text file using the procedure outlined in the Chem 140 manual. Conc (mg/L),Measurement l,Measurement 2,Measurement 3,Measurement 4,Measurement 5,Measurement 6,Measurement 7,Measurement 8,Measurement 9,Measurement lO 0.00,0.0054,0.0054,0.0053,0.0057,0.0061,0.0054,0.0055,0.0058,0.0054,0.0055 0.03,0.0116,0.0ll6,0.0116,0.0125,0.0132,0.0118,0.0120,0.0126,0.0118,0.0120 0.10,0.0262,0.0262,0.026l,0.0281,0.0298,0.0266,0.0271,0.0286,0.0267,0.0273 0.20,0.0720,0.0720,0.0719,0.0755,0.0785,0.0728,0.0737,0.0764,0.0730,0.0741 0.40,0.0886,0.0886,0.0885,0.0953,0.1009,0.0902,0.09l9,0.0970,0.0906,0.0927 0.80,0.1718,0.1718,0.l717,0.1849,0.1957,0.l750,0.l783,0.1882,0.l758,0.1799 l.60,0.3382,0.3382,0.3381,0.364l,0.3853,0.3446,0.3511,0.3706,0.3462,0.3543 3.20,0.6710,0.6710,0.6709,0.7225,0.7645,0.6838,0.6967,0.7354,0.6870,0.7031 3.75,0.7854,0.7854,0.7853,0.8457,0.8948,0.8004,0.8155,0.8608,0.804l,0.8230 4.00,0.8374,0.8374,0.8373,0.9017,0.9541,0.8534,0.8695,0.9178,0.8574,0.8775 After you have completed the linear regression analysis within Excel, answer the questions below
Step by Step Solution
There are 3 Steps involved in it

Get step-by-step solutions from verified subject matter experts