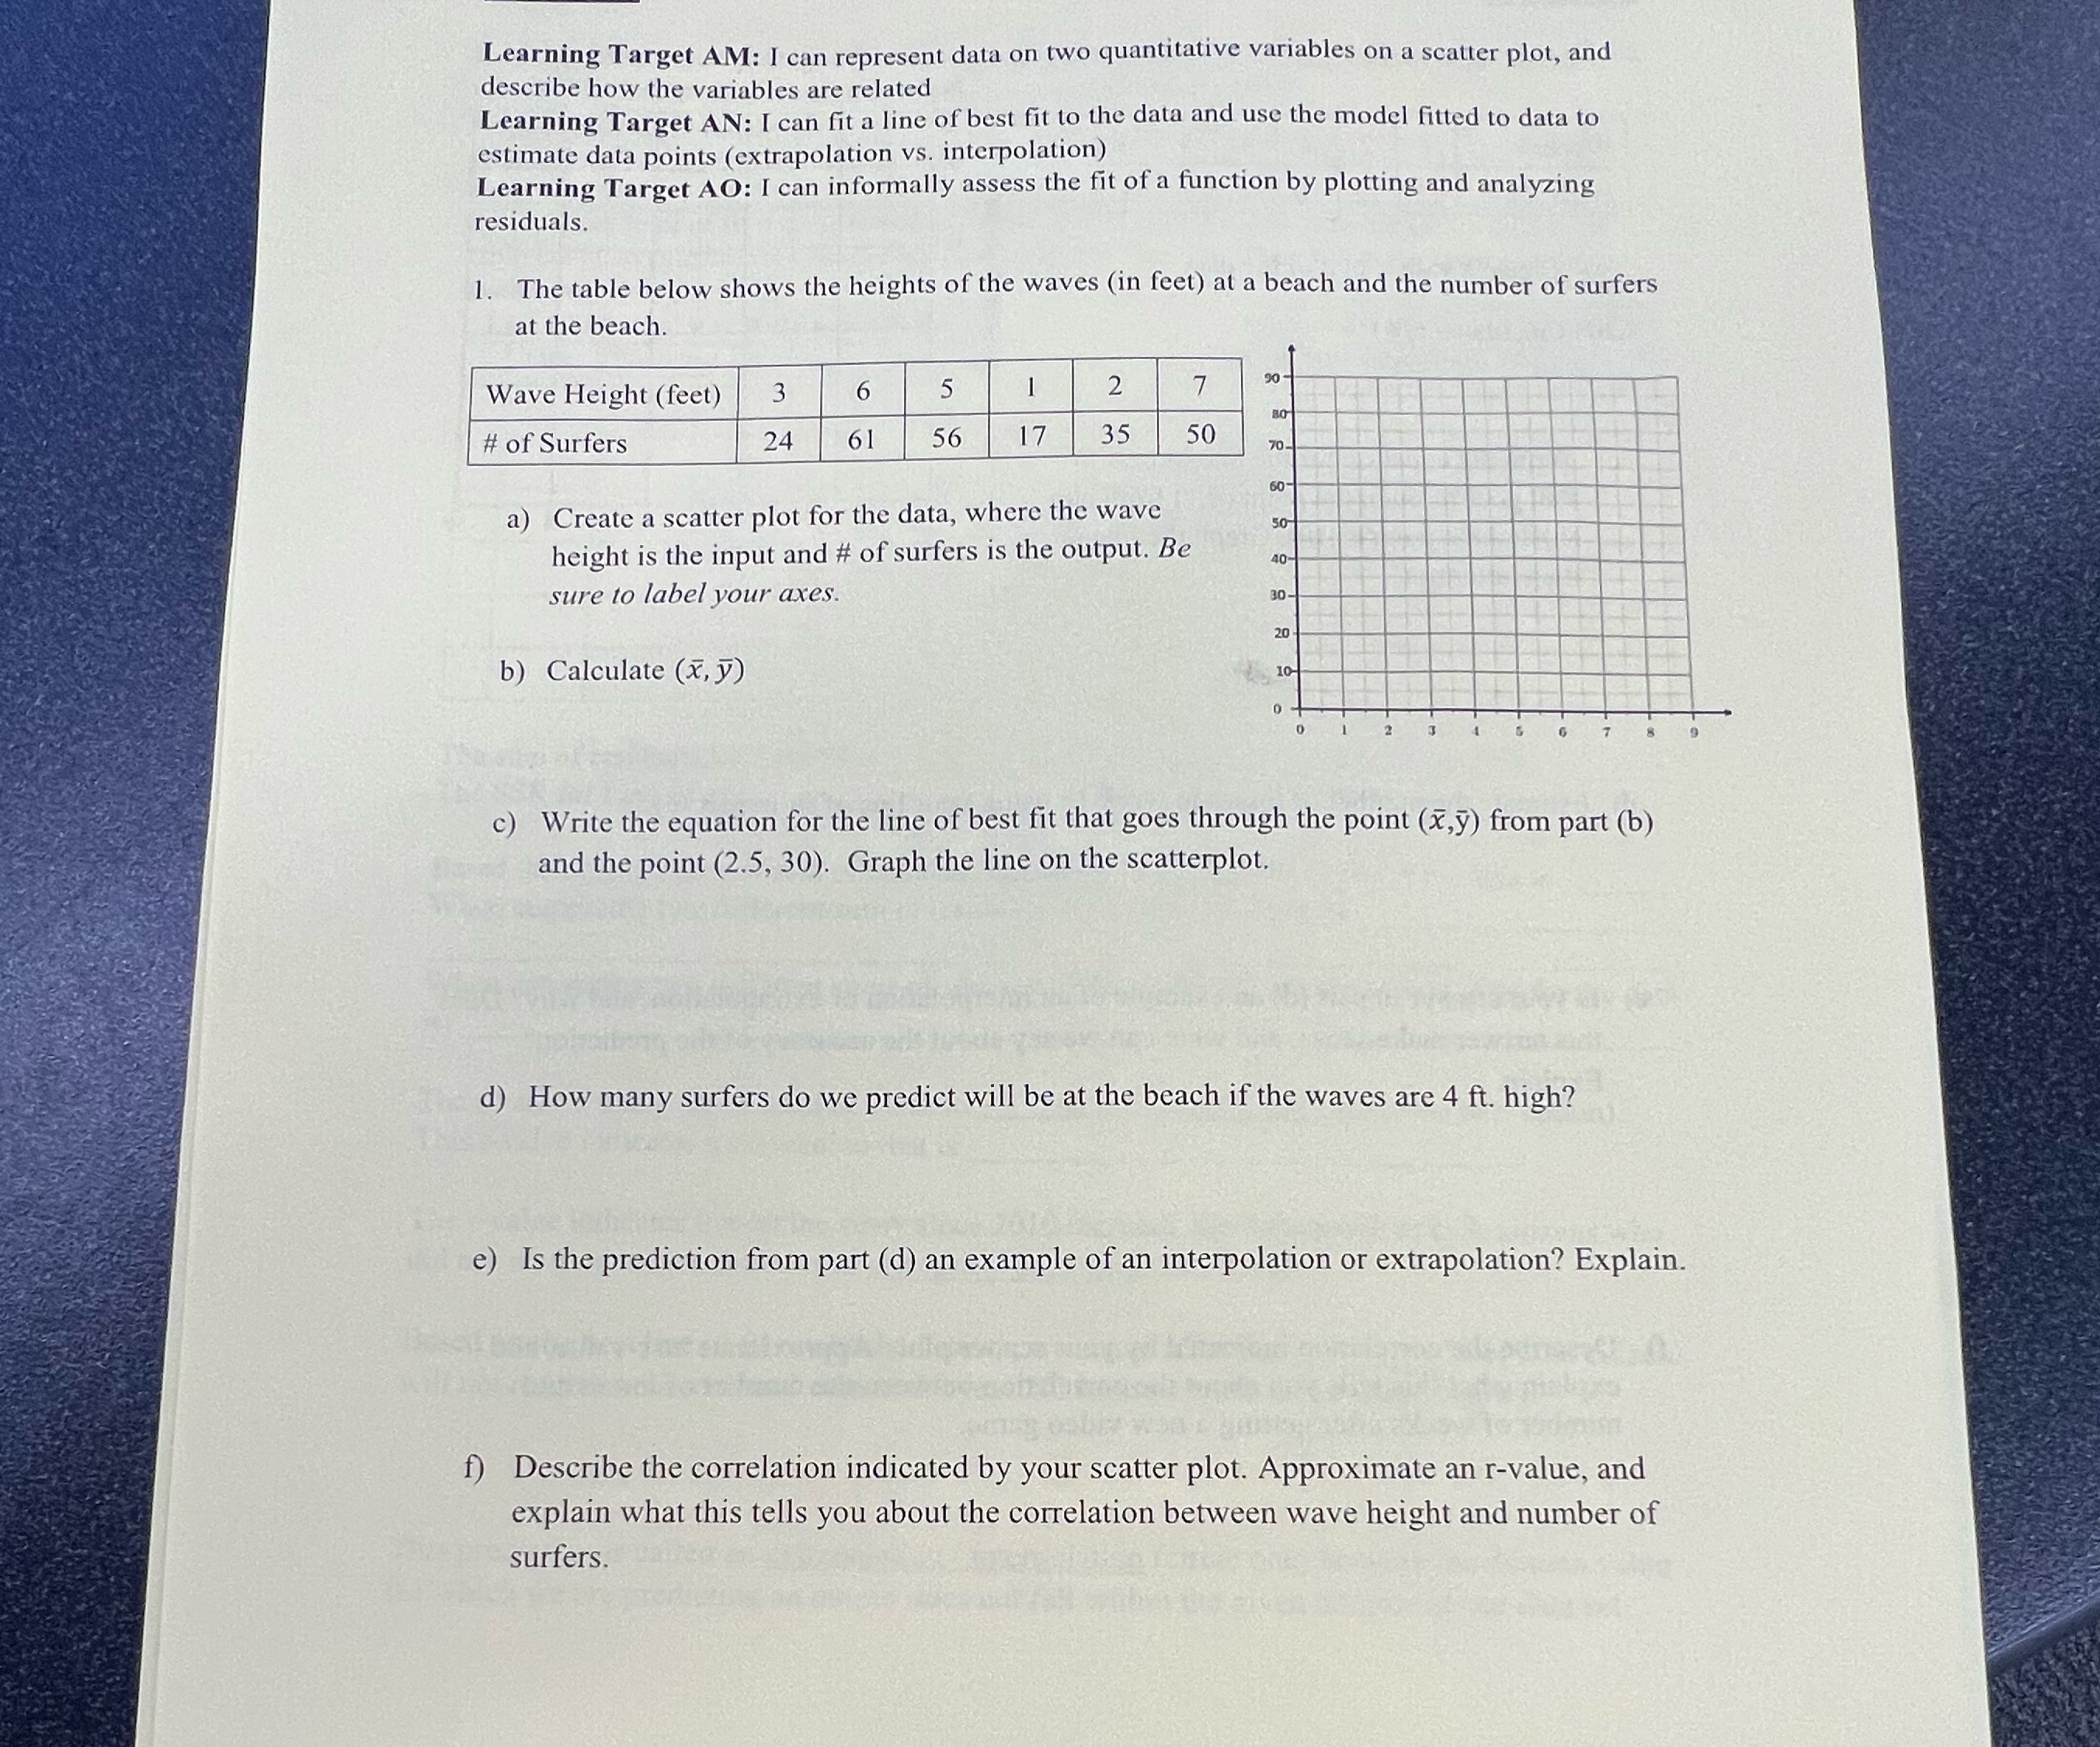
Question: Learning Target AM: I can represent data on two quantitative variables on a scatter plot, and describe how the variables are related Learning Target AN:

Learning Target AM: I can represent data on two
Learning Target AM: I can represent data on two quantitative variables on a scatter plot, and describe how the variables are related Learning Target AN: [can t :1 line of best t to the dam and use the model tted to data to estimate data points (extrapolation vs. interpolation) . Learning Target A0: I can informally assess the t ofn function by plotting and analyzing residuals. l. The table below shows the heights of the waves (in feet) at a beach and the number of surfers at the beach. Wave Height (feet) 3 6 5 # of Surfers 24 61 56 35 21) Create a scatter plot for the data, where the wave height is the input and # of surfers is the output. Be sure [0 label your axes. b) Calculate (i, j?) c) Write the equation for the line of best t that goes through the point (2,?) from part (b) and the point (2.5, 30). Graph the line on the scatterplot, d) How many surfers do we predict will be at the beach if the waves are 4 it. high? e) Is the prediction from part (d) an example of an interpolation or extrapolation? Explain. f) Describe the correlation indicated by your scatter plot. Approximate an r-value, and explain what this tells you about the correlation between wave height and number of surfers

Step by Step Solution

There are 3 Steps involved in it

1 Expert Approved Answer
Step: 1 Unlock blur-text-image
Question Has Been Solved by an Expert!

Get step-by-step solutions from verified subject matter experts

Step: 2 Unlock
Step: 3 Unlock

Students Have Also Explored These Related Mathematics Questions!