

Question: leave the gray boxes empty please #1. The Fastgro Fertilizer Company distributes fertilizer to various lawn and garden shops. The company must base its quarterly
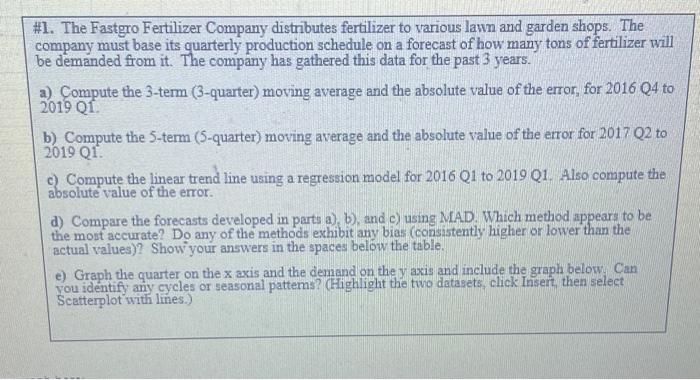
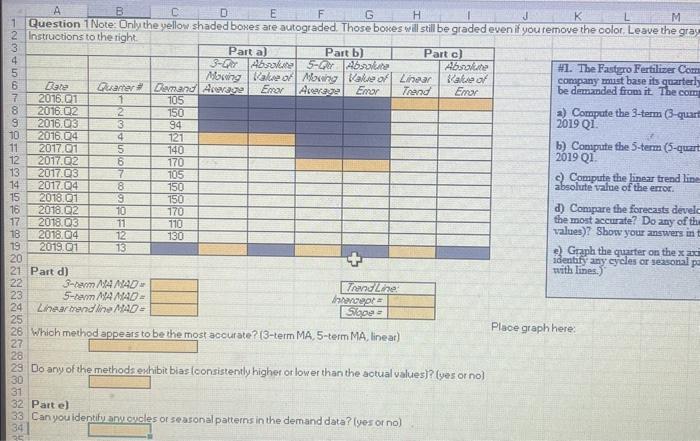
\#1. The Fastgro Fertilizer Company distributes fertilizer to various lawn and garden shops. The company must base its quarterly production schedule on a forecast of how many tons of fertilizer will be demanded from it. The company has gathered this data for the past 3 years. a) Compute the 3-term (3-quarter) moving average and the absolute value of the error, for 2016 Q4 to 2019 Q1. b) Compute the 5-term ( 5 -quarter) moving average and the absolute value of the error for 2017 Q2 to 2019 Q1. c) Compute the linear trend line using a regression model for 2016 Q1 to 2019 Q1. Also compute the absolute value of the error. d) Compare the forecasts developed in parts a), b), and c) using MAD. Which method appears to be the mout accurate? Do any of the methods exhibit any bias (consistently higher or lower than the actual values)? Show your answers in the spaces below the table. e) Graph the quarter on the x axis and the demand on the y axis and include the graph below. Can you identify any cycles or seasonal pattems? (Highlight the two datasets, click Insert, then select Scatterplot with limes.) Part d) 3cos1/44M4D=5senNA4MAD=LinearmenstineMMaO= Which method appears to be the most acourate? (3-term MA, 5-term MA, linear) \#1. The Fastgro Fertilizer Com company mint base its quarterly be demanded from it The com a) Compute the 3-term (3-quart 2019 Q1. b) Compute the 5-term (5-quar: 2019 Q1. c) Compute the linear trend line absolute vilue of the error. d) Compare the forecants develc the moit accurate? Do any of th values)? Show your answers in e) Grph the quarter on the x ax identify any cycles or seasonal p with lines.) Do any of the methods oshibit bias (consistently higher or lower than the aotual values)? (yes or no)
Step by Step Solution
There are 3 Steps involved in it

Get step-by-step solutions from verified subject matter experts