

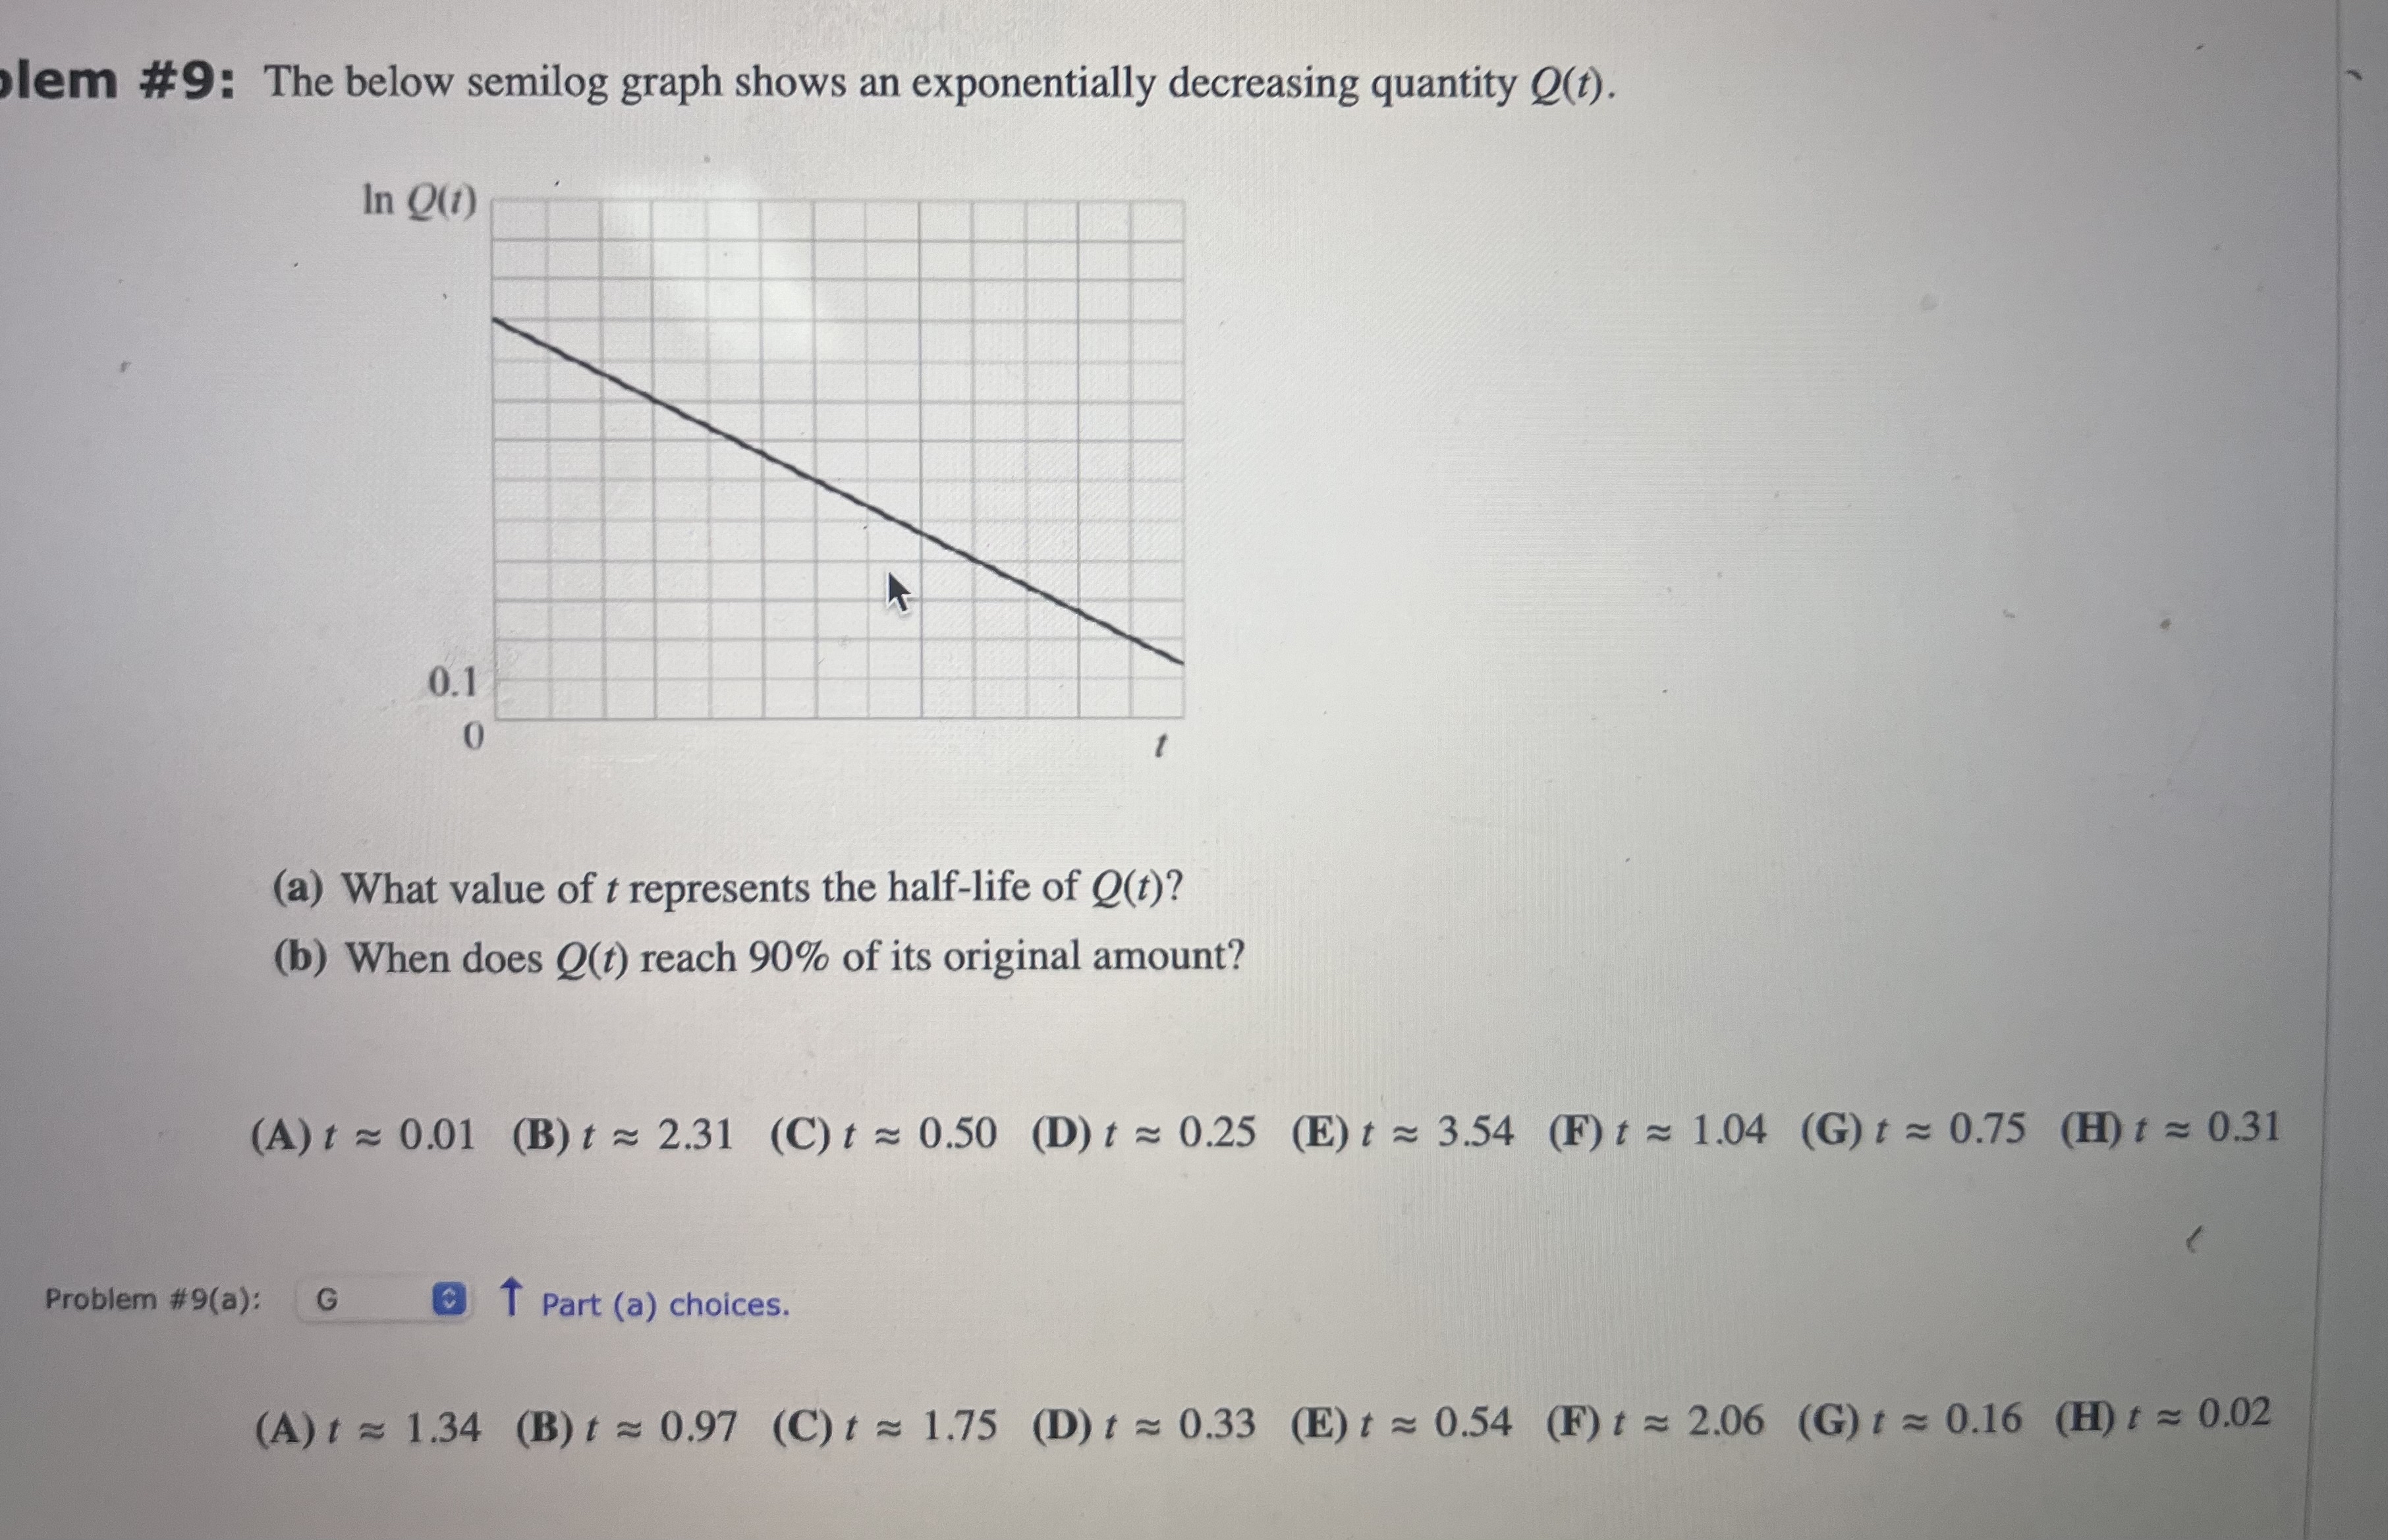
Question: lem # 9 : The below semilog graph shows an exponentially decreasing quantity Q ( t ) . ( a ) What value of t
lem #: The below semilog graph shows an exponentially decreasing quantity
a What value of represents the halflife of
b When does reach of its original amount?
A~~
B~~
C~~
D~~
~~
~~
~~
~~
Problem #a: uarr Part a choices.
A~~
~~
C~~
D~~
~~
~~
~~
~~
Step by Step Solution
There are 3 Steps involved in it
1 Expert Approved Answer
Step: 1 Unlock

Question Has Been Solved by an Expert!
Get step-by-step solutions from verified subject matter experts
Step: 2 Unlock
Step: 3 Unlock