

Question: Lesson 1.2 Representing Categorical Data Aim: How do we represent categorical data i different ways? Objective: 1B: Students will be able to represent categorical
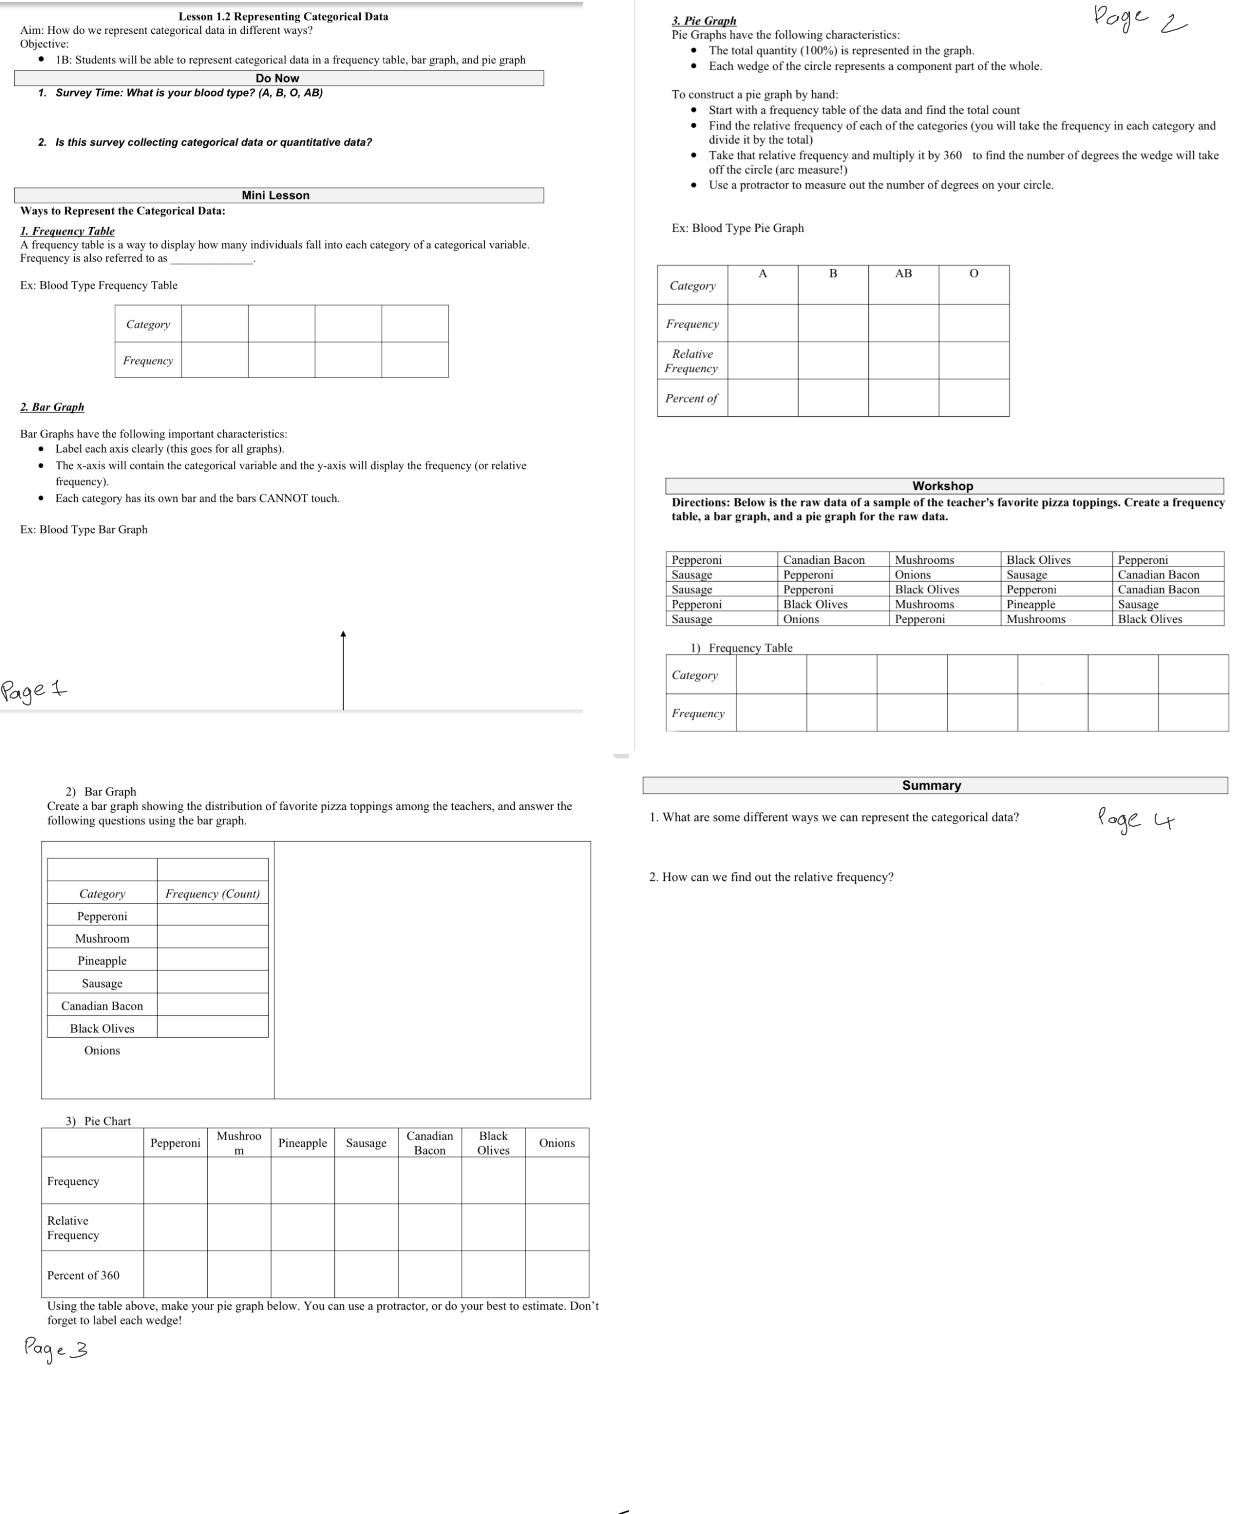
Lesson 1.2 Representing Categorical Data Aim: How do we represent categorical data i different ways? Objective: 1B: Students will be able to represent categorical data in a frequency table, bar graph, and pie graph. Do Now 1. Survey Time: What your blood type? (A, B, O, AB) 2. Is this survey collecting categorical data or quantitative data? 3. Pie Graph Pie Graphs have the following characteristics: The total quantity (100%) is represented in the graph. Each wedge of the circle represents a component part of the whole. To construct a pie graph by hand: Start with a frequency table of the data and find the total count Page 2 Find the relative frequency of each of the categories (you will take the frequency in each category and divide it by the total) Take that relative frequency and multiply it by 360 to find the number of degrees the wedge will take off the circle (arc measure!) Use a protractor to measure out the number of degrees on your circle. Mini Lesson Ways to Represent the Categorical Data: 1. Frequency Table A frequency table is a way to display how many individuals fall into each category of a categorical variable. Frequency is also referred to as Ex: Blood Type Frequency Table Category Frequency 2. Bar Graph Bar Graphs have the following important characteristics: Label each axis clearly (this goes for all graphs). The x-axis will contain the categorical variable and the y-axis will display the frequency (or relative. frequency). Each category has its own bar and the bars CANNOT touch. Ex: Blood Type Bar Graph Page 1 2) Bar Graph Create a bar graph showing the distribution of favorite pizza toppings among the teachers, and answer the following questions using the bar graph. Category Frequency (Count) Pepperoni Mushroom Pineapple Sausage Canadian Bacon Black Olives Onions 3) Pie Chart Frequency Relative Frequency Mushroo Canadian Black Pepperoni Pineapple Sausage Onions Bacon Olives m Percent of 360 Using the table above, make your pie graph below. You can use a protractor, or do your best to estimate. Don't forget to label each wedge! Page 3 Ex: Blood Type Pie Graph A B AB 0 Category Frequency Relative Frequency Percent of Workshop Directions: Below is the raw data of a sample of the teacher's favorite pizza toppings. Create a frequency table, a bar graph, and a pie graph for the raw data. Pepperoni Sausage Sausage Pepperoni Sausage Canadian Bacon Pepperoni Pepperoni Black Olives Onions Mushrooms Onions Black Olives Mushrooms Pepperoni Black Olives Sausage Pepperoni Pineapple Mushrooms Pepperoni Canadian Bacon Canadian Bacon Sausage Black Olives 1) Frequency Table Category Frequency Summary 1. What are some different ways we can represent the categorical data? 2. How can we find out the relative frequency? Page 4
Step by Step Solution
There are 3 Steps involved in it

Get step-by-step solutions from verified subject matter experts