

Question: LESSON 2 ASSIGNMENT CH 4 Name MULTIPLE CHOICE. Choose the one alternative that best completes the statement or answers the question. 1) All of the
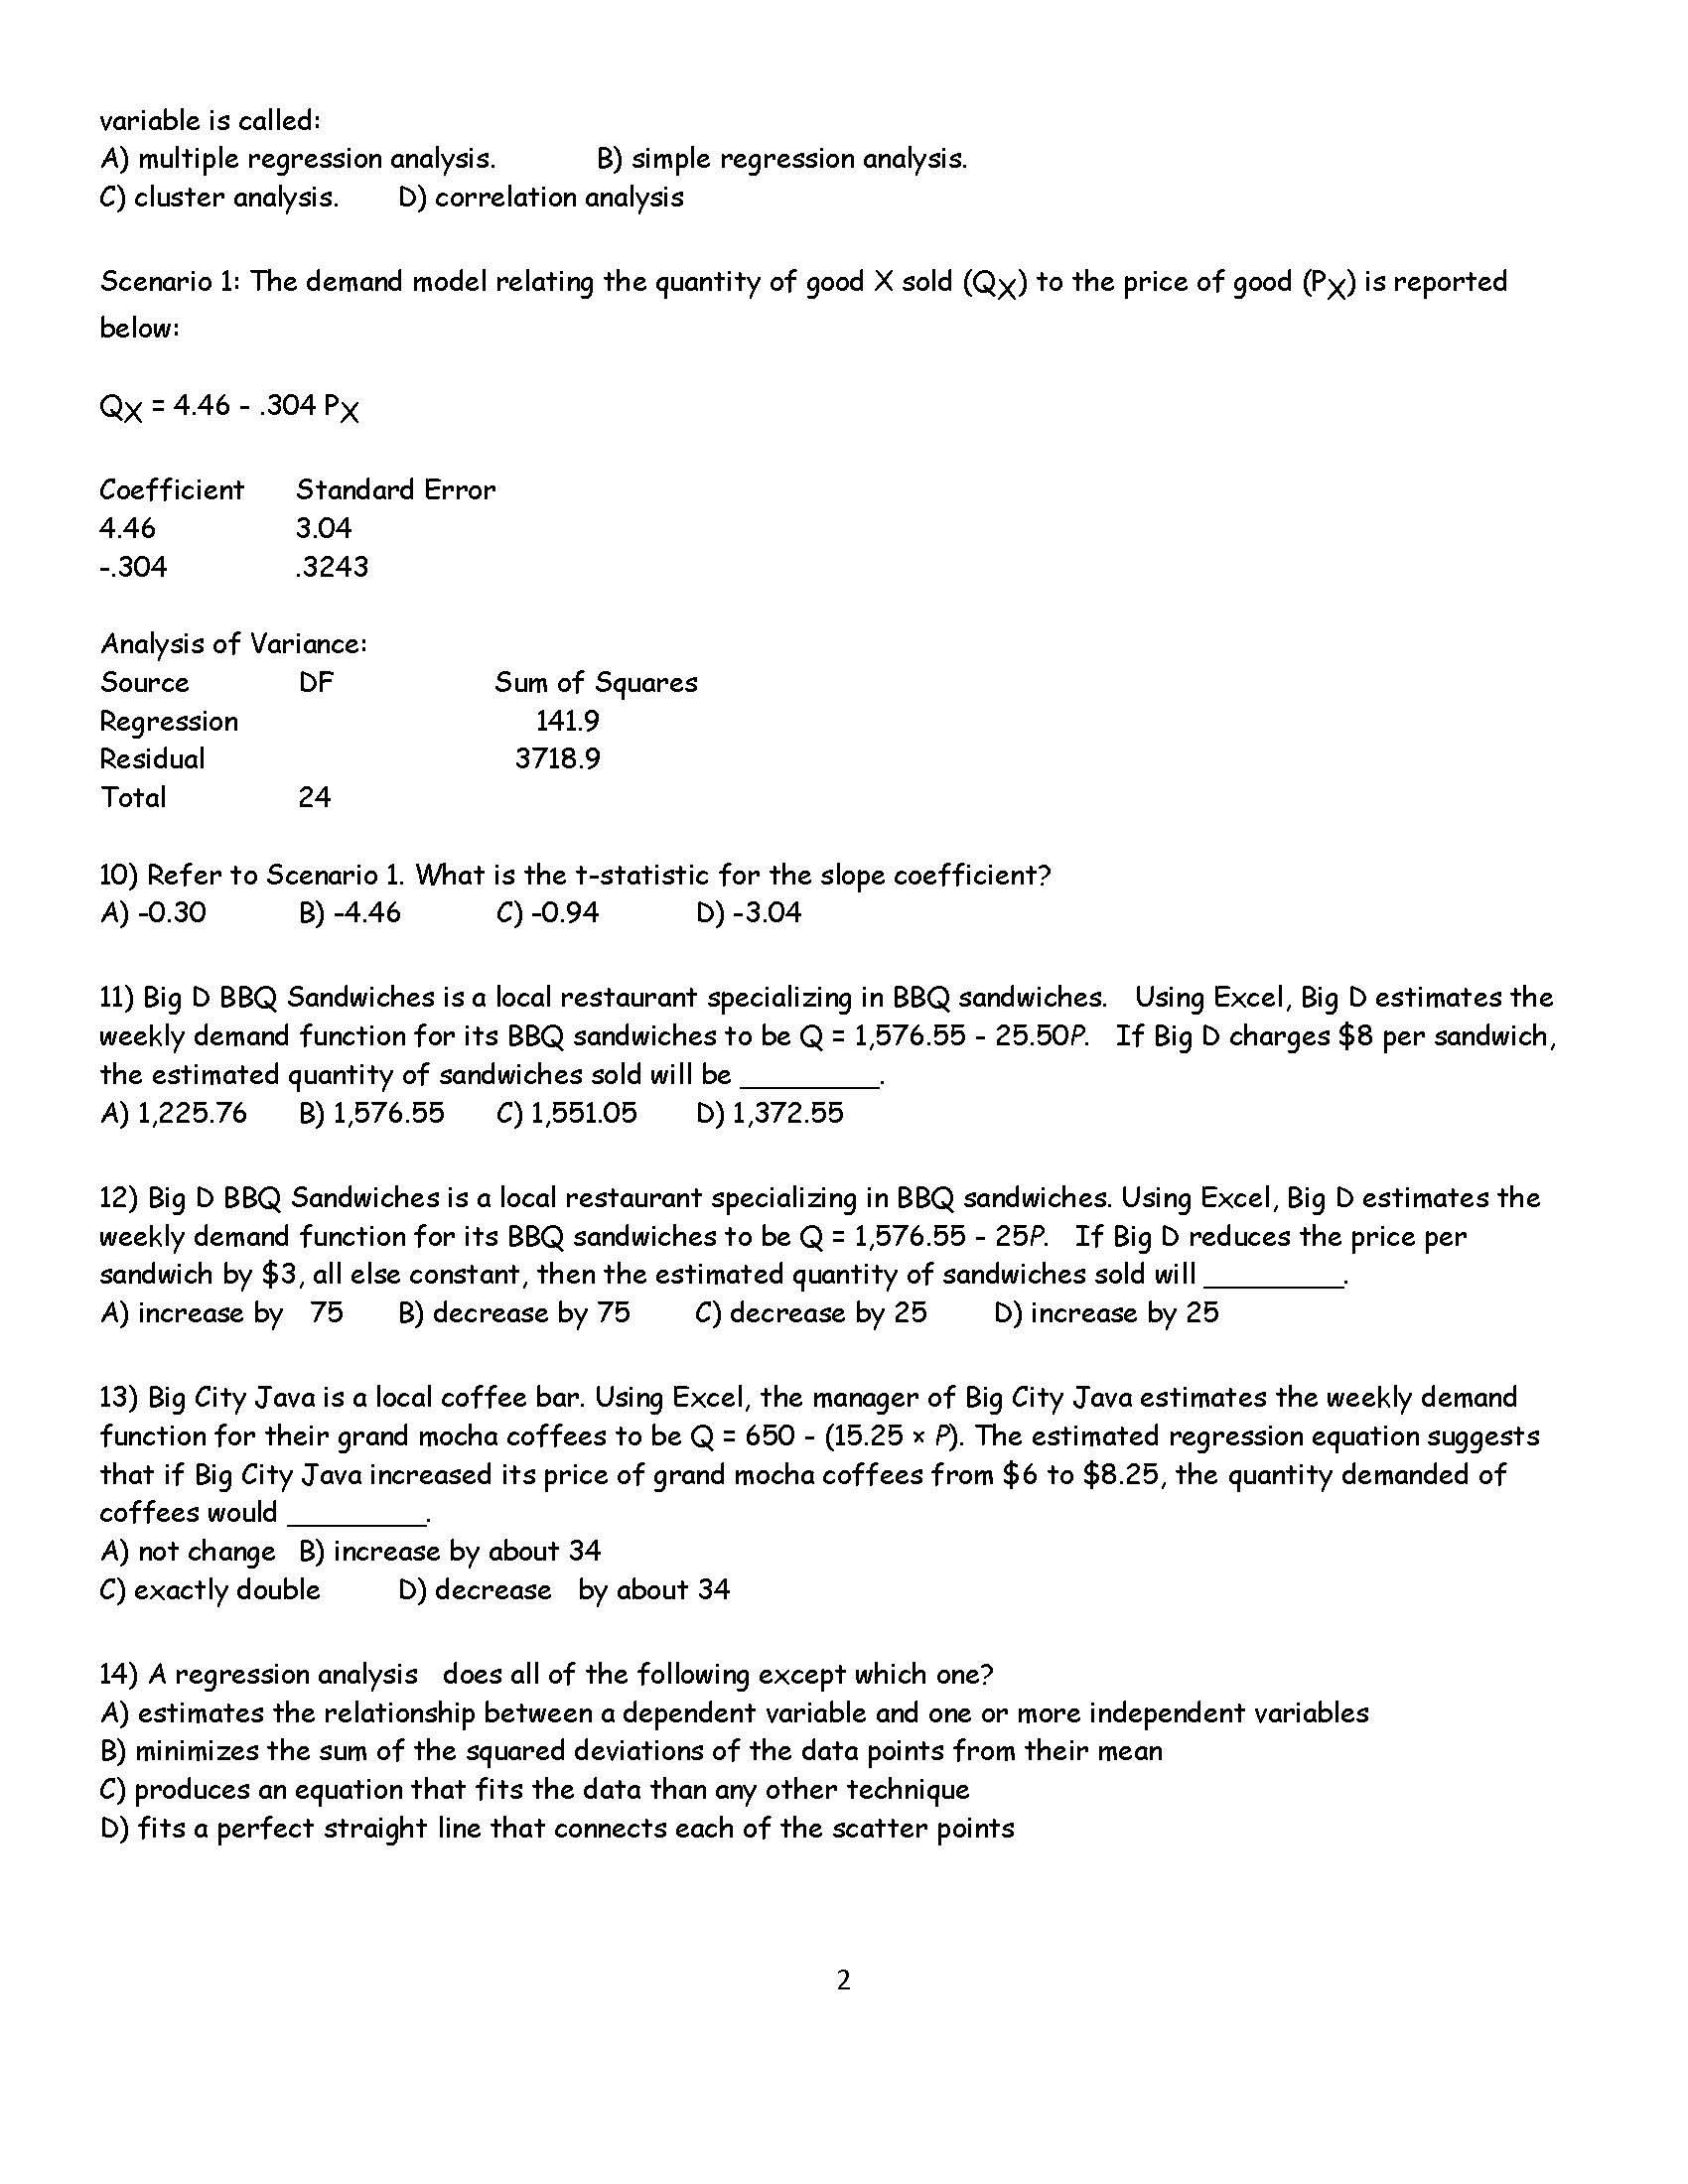
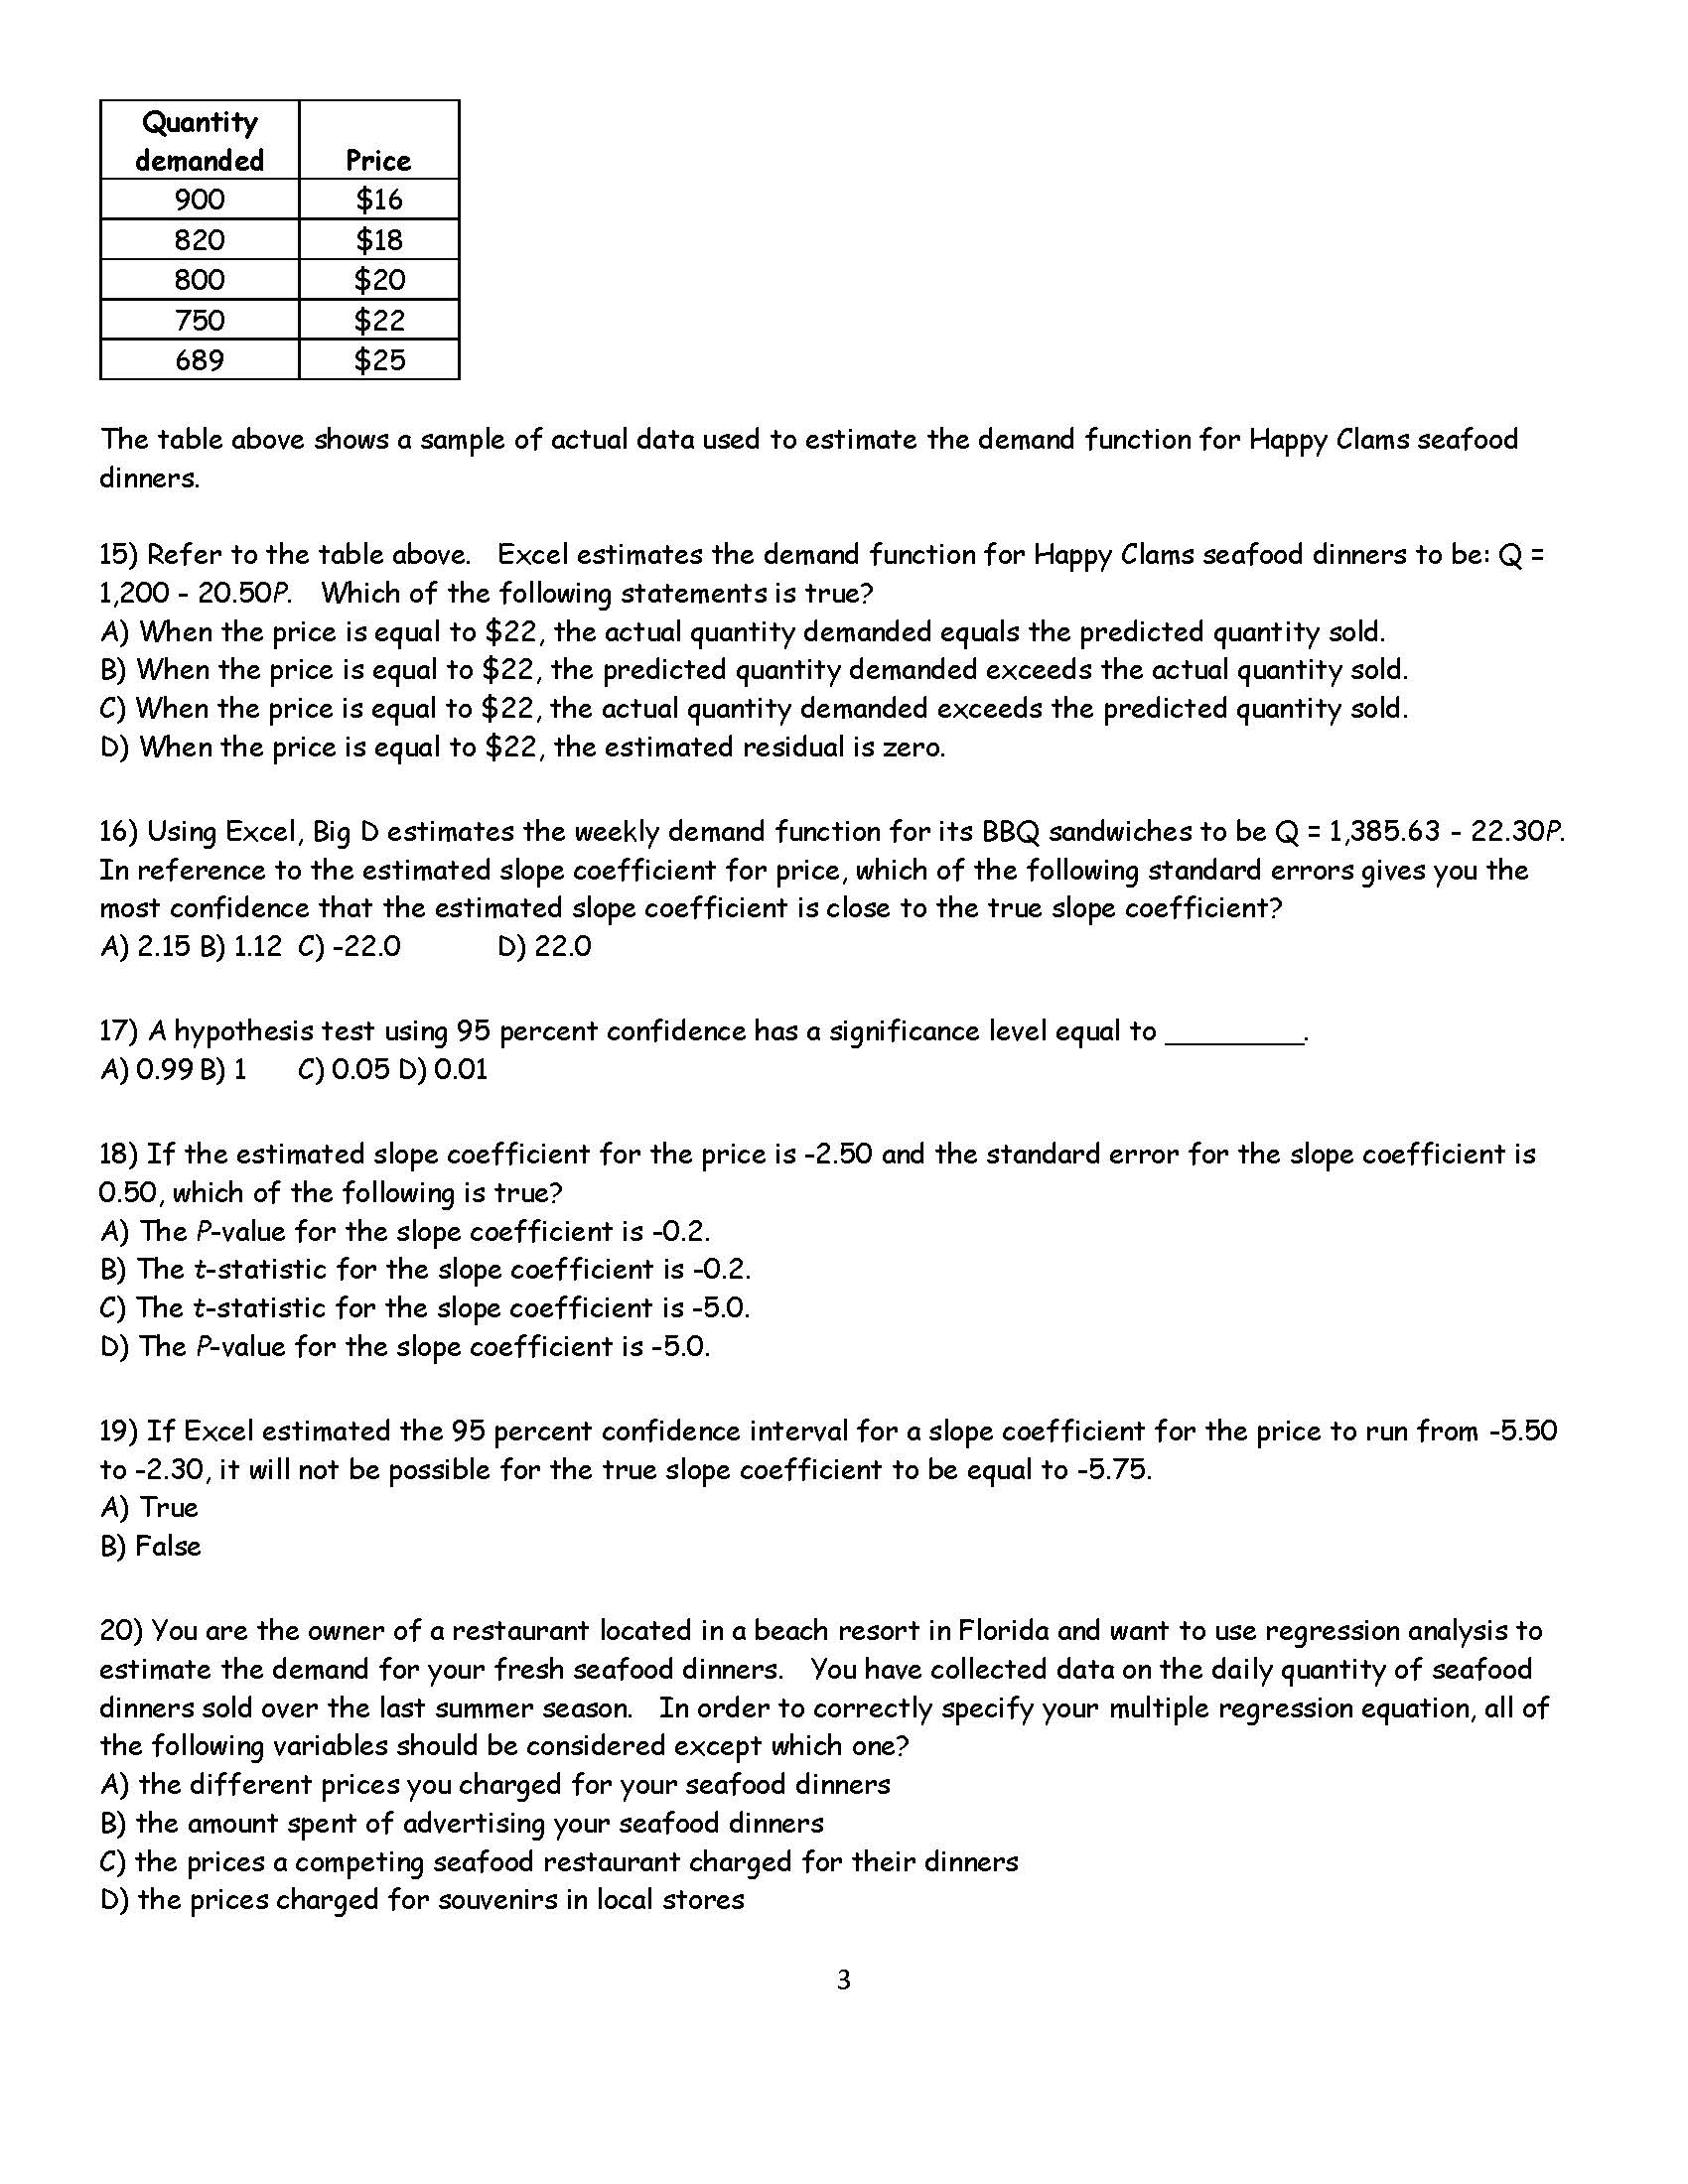
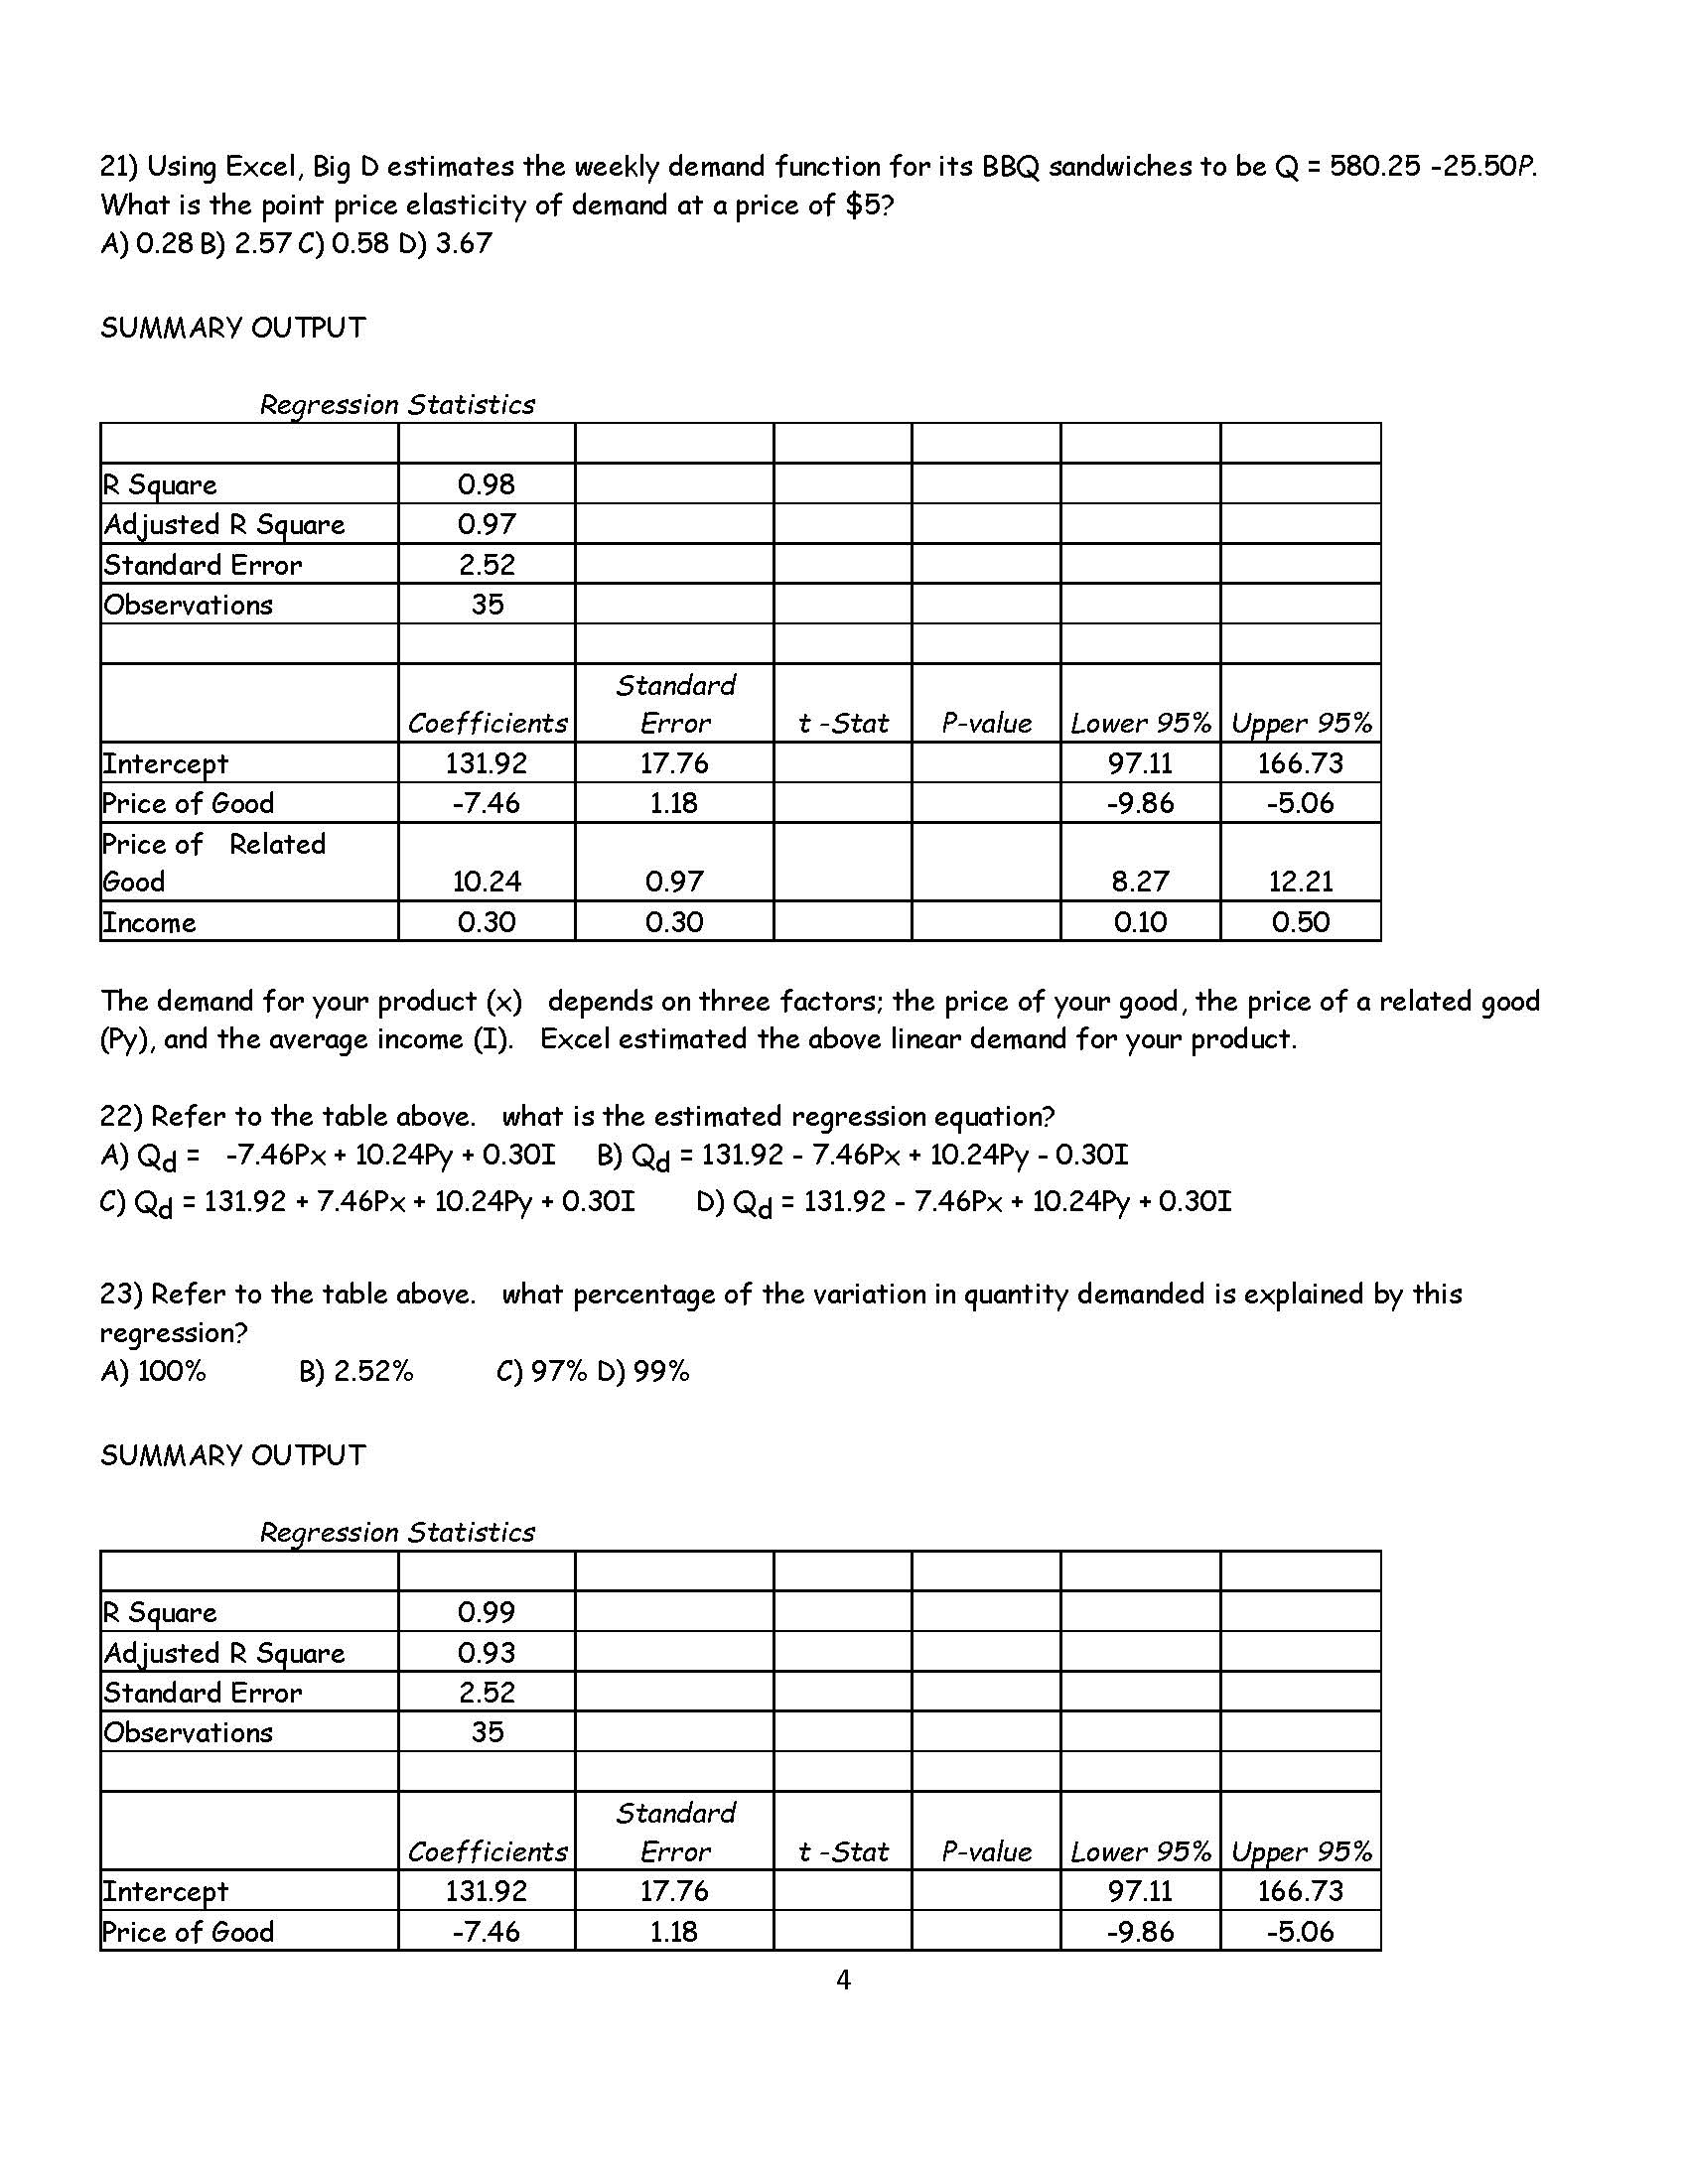
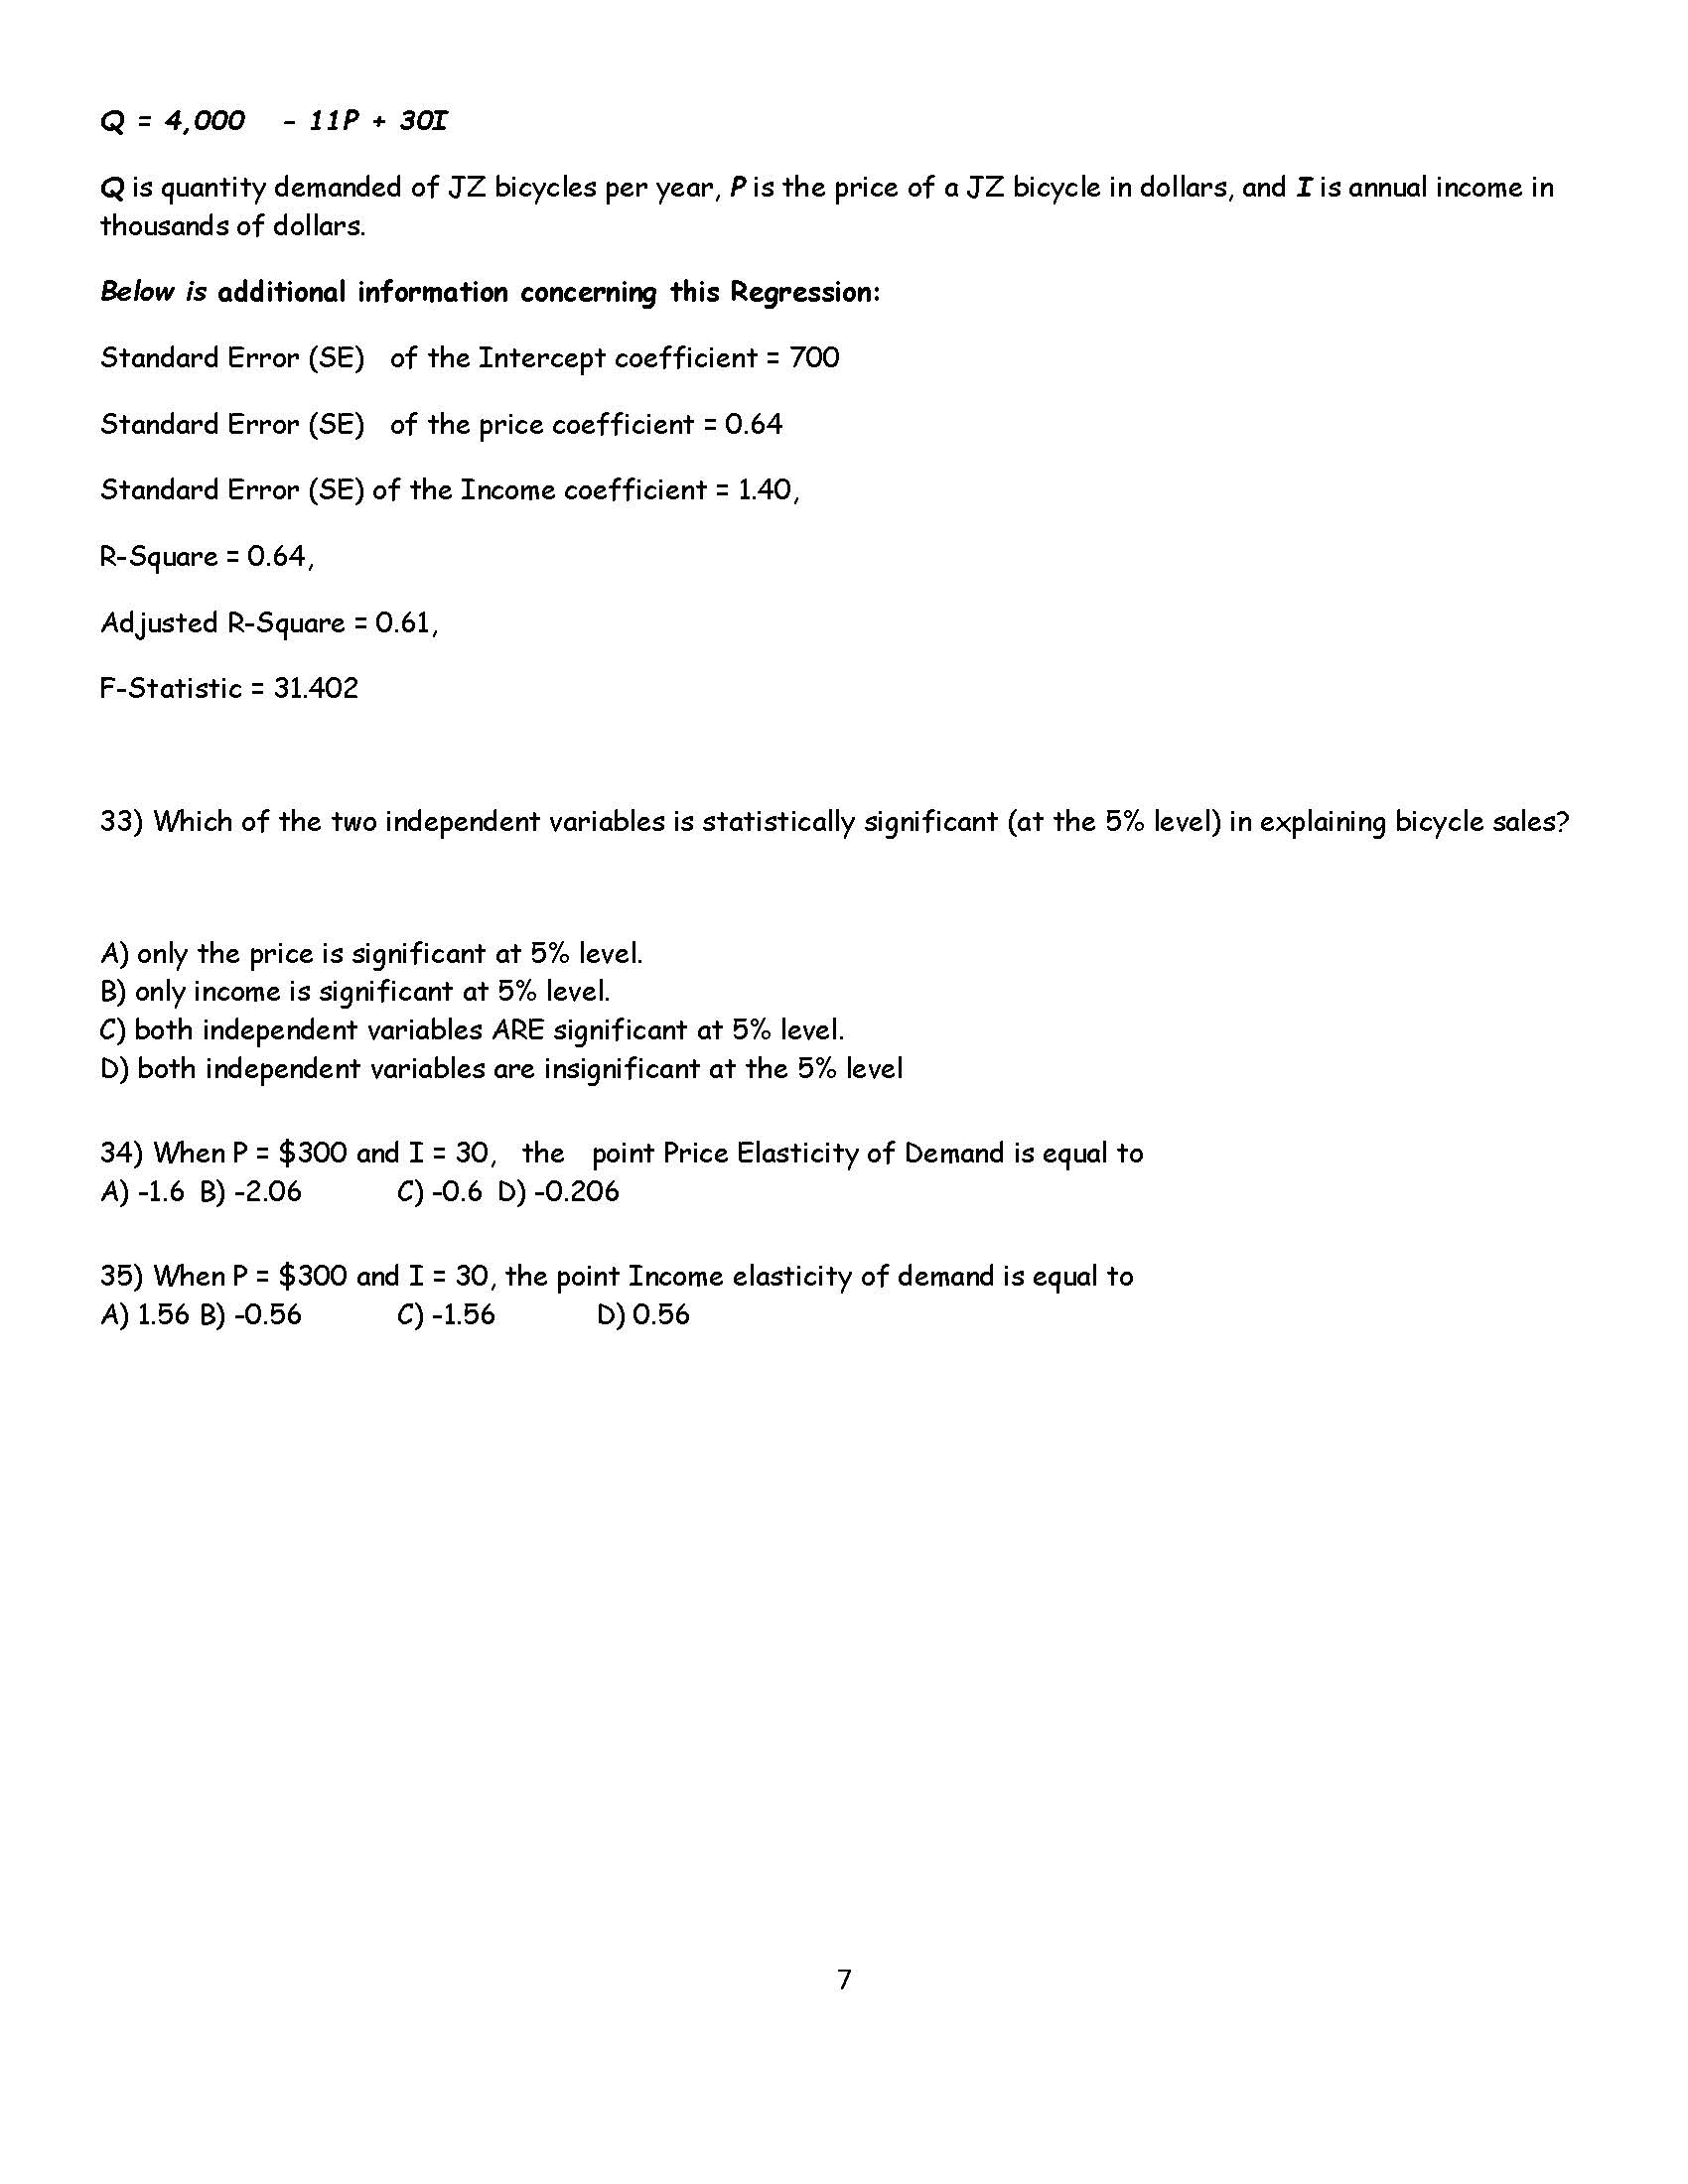
LESSON 2 ASSIGNMENT CH 4 Name MULTIPLE CHOICE. Choose the one alternative that best completes the statement or answers the question. 1) All of the following are limitations of direct consumer surveys except: A) the possibility of response biases because survey respondents may not want to reveal their true preferences. B) the likelihood that respondents will deliberately and systematically mislead interviewers. C) the possibility that the type of questions asked may unintentionally bias the respondent's answers. D) the possibility that consumers' responses may not reflect their actual behavior in the market place. 2) Data collected on the same observation unit at a number of points in time are called: A) cross-section data. B) time series data. C) panel data. D) none of the above. 3) Regression analysis that analyzes the relationship between one dependent variable and several independent variables is called: A) cluster analysis. B) correlation analysis. C) multiple regression analysis. D) simple regression analysis. 4) If the estimated demand for a good is Q = 1,568.23 - 18.67P. then the point price elasticity of demand when the price is $42 is and demand at this price is A) -2.5: elastic B) -1.27: elastic C) -1.00; unitary elastic D) -O.50; inelastic 5) The intercept of the equation: Y = 0.09 + 1.5x is 1.5. A) True B) False 6) In a regression analysis that estimates a demand function, the dependent variable is the A) quantity and price of the good B) consumers' income C) quantity demanded D) prices of related goods 7) The approach to analyzing consumer behavior that asks consumers to rank and choose among different product attributes to reveal their relative valuation of different characteristics is called: A) a direct consumer survey. B) conjoint analysis. C) contingent valuation. D) the hedonic estimation technique. 8) An approach to analyzing consumer behavior in which consumer reaction to different prices is analyzed in a laboratory situation or a test market is called: A) non-price experiments. 3) focus groups. C) price experiments. D) none of the above. 9) Regressional analysis that analyzes the relationship between one dependent variable and one independent 1 variable is called: A) mulTipIe regression analysis. B) simple regression analysis. C) clusTer analysis. D) correlaTion analysis Scenario 1: The demand model relaTing The quanTiTy of good X sold (QX) To The price of good (PX) is reporTed below: QX = 4.46 .304 PX CoefficienT STandard Error 4.46 3.04 -.304 .3243 Analysis of Variance: Source DF Sum of Squares Regression 141.9 Residual 3718.9 ToTal 24 10) Refer To Scenario 1. WhaT is The T-sTaTisTic for The slope coefficienT? A) -o.3o B) -4.46 C) -o.94 D) -3.04 11) Big D BBQ Sandwiches is a local resTauranT specializing in BBQ sandwiches. Using Excel, Big D esTimaTes The weekly demand funcTion for iTs BBQ sandwiches To be Q = 1,576.55 - 25.50P. If Big D charges $8 per sandwich, The esTimaTed quanTiTy of sandwiches sold will be . A) 1,225.76 B) 1,576.55 C) 1,551.05 D) 1,372.55 12) Big D BBQ Sandwiches is a local resTauranT specializing in BBQ sandwiches. Using Excel, Big D esTimaTes The weekly demand funcTion for iTs BBQ sandwiches To be Q = 1,576.55 - 25P. If Big D reduces The price per sandwich by $3, all else consTanT, Then The esTimaTed quanTiTy of sandwiches sold will A) increase by 75 B) decrease by 75 C) decrease by 25 D) increase by 25 13) Big CiTy Java is a local coffee bar. Using Excel, The manager of Big CiTy Java esTimaTes The weekly demand funcTion for Their grand mocha coffees To be Q = 650 - (15.25 x P). The esTimaTed regression equaTion suggesTs ThaT if Big CiTy Java increased iTs price of grand mocha coffees from $6 To $8.25, The quanTiTy demanded of coffees would A) noT change B) increase by abouT 34 C) exacTIy double D) decrease by abouT 34 14) A regression analysis does all of The following excepT which one? A) esTimaTes The relaTionship beTween a dependenT variable and one or more independenT variables B) minimizes The sum of The squared deviaTions of The daTa poinTs from Their mean C) produces an equaTion ThaT fiTs The daTa Than any oTher Technique D) fiTs a perfecT sTraighT line ThaT connecTs each of The scaTTer poinTs -m demanded \" _ _ _ _ 820 800 750 689 The Table above shows a sample of acTual daTa used To esTimaTe The demand funcTion for Happy Clams seafood dinners. 15) Refer To The Table above. Excel esTimaTes The demand funcTion for Happy Clams seafood dinners To be: Q = 1,200 - 20.50P. Which of The following sTaTemenTs is True? A) When The price is equal To $22, The acTual quanTiTy demanded equals The predicTed quanTiTy sold. B) When The price is equal To $22, The predicTed quanTiTy demanded exceeds The acTual quanTiTy sold. C) When The price is equal To $22, The acTual quanTiTy demanded exceeds The predicTed quanTiTy sold. D) When The price is equal To $22, The esTimaTed residual is zero. 16) Using Excel, Big D esTimaTes The weekly demand funcTion for iTs BBQ sandwiches To be Q = 1,385.63 - 22.30P. In reference To The esTimaTed slope coefficienT for price, which of The following sTandard errors gives you The mosT confidence ThaT The esTimaTed slope coefficienT is close To The True slope coefficienT? A) 2.15 B) 1.12 C) -22.0 D) 22.0 17) A hypoThesis TesT using 95 percenT confidence has a significance level equal To A) 0.99 B) 1 C) 0.05 D) 0.01 18) If The esTimaTed slope coefficienT for The price is -2.50 and The sTandard error for The slope coefficienT is 0.50, which of The following is True? A) The P-value for The slope coefficienT is -0.2. B) The tsTaTisTic for The slope coefficienT is -0.2. C) The tsTaTisTic for The slope coefficienT is -5.0. D) The P-value for The slope coefficienT is -5.0. 19) If Excel esTimaTed The 95 percenT confidence inTerval for a slope coefficienT for The price To run from -5.50 To -2.30, iT will noT be possible for The True slope coefficienT To be equal To -5.75. A) True B) False 20) You are The owner of a resTauranT locaTed in a beach resorT in Florida and wanT To use regression analysis To esTimaTe The demand for your fresh seafood dinners. You have collecTed daTa on The daily quanTiTy of seafood dinners sold over The lasT summer season. In order To correchy specify your mulTiple regression equaTion, all of The following variables should be considered excepT which one? A) The differenT prices you charged for your seafood dinners B) The amounT spenT of adverTising your seafood dinners C) The prices a compeTing seafood resTauranT charged for Their dinners D) The prices charged for souvenirs in local sTores 21) Using Excel, Big D estimates the weekly demand function for its BBQ sandwiches to be Q = 580.25 -25.50P. What is the point price elasticity of demand at a price of $5? A) 0.28 B) 2.57 C) 0.58 D) 3.67 SUMMARY OUTPUT Regression Statistics Square 0.98 Adjusted R Square 0.97 Standard Error 2.52 Observations 35 Standard Coefficients Error t -Stat P-value Lower 95% Upper 95% Intercept 131.92 17.7 97.11 166.73 Price of Good -7.46 1.18 9.86 -5.06 Price of Related Good 10.24 0.97 8.27 12.21 Income 0.30 ).30 0.10 0.50 The demand for your product (x) depends on three factors; the price of your good, the price of a related good (Py), and the average income (I). Excel estimated the above linear demand for your product. 22) Refer to the table above. what is the estimated regression equation? A) Qd = -7.46Px + 10.24Py + 0.301 B) Qd = 131.92 - 7.46PX + 10.24Py - 0.301 C) Qd = 131.92 + 7.46PX + 10.24Py + 0.301 D) Qd = 131.92 - 7.46PX + 10.24Py + 0.301 23) Refer to the table above. what percentage of the variation in quantity demanded is explained by this regression? A) 100% B) 2.52% C) 97% D) 99% SUMMARY OUTPUT Regression Statistics Square 0.99 Adjusted R Square 0.93 Standard Error 2.52 Observations 35 Standard Coefficients Error t -Stat P-value Lower 95% Upper 95% Intercept 131.92 17.76 97.11 166.73 Price of Good -7.46 1.18 -9.86 -5.06Price of Related Good 10.24 0.97 8.27 12.21 Income 0.30 0.30 0.10 0.50 The demand for your product (x) depends on three factors; the price of the good, the price of a related good, and the average income. Excel estimated the above linear demand for your product 24) Refer to the table above. By examining the t-statistics associated with the regression coefficients, at the 5 percent significance level, which of the independent variables are statistically different from zero? A) Price of good, price of related good and Income B) price of good only C) Price of good and income. D) Price of good and price of related good SUMMARY OUTPUT Regression Statistics Square 0.98 Adjusted R Square 0.97 Standard Error 2.52 Observations 35 Standard Coefficients Error t -Stat P-value Lower 95% Upper 95% Intercept 131.92 17.76 7.43 0.0 97.11 166.73 Price of Good 7.46 1.18 -6.34 0.00 -9.86 -5.06 Price of Related Goo 10.24 0.97 10.60 0.00 8.27 12.21 Income 0.30 0.10 3.00 0.0 0.10 0.50 The demand for your product (x) depends on three factors; the price of the good, the price of a related good, and the average income. Excel estimated the above linear demand for your product. 25) Refer to the table above. A $1 decrease in the price of your good will lead to a(n) in the quantity demanded by A) decrease; 7.46 B) increase; 7.46 C) increase; 10.24 D) decrease; 10.24 26) Refer to the table above. A $2 increase in the price of the related good will lead to a(n) in the quantity demanded of your good by an indication that your good and the related good are A) increase; 20.48; substitutes B) decrease; 20.48; complements C) increase; 10.24; substitutes D) decrease; 10.24; complements 27) Refer to the table above. Which of the following statements is true? A) Only income and the price of related goods in the above regression have a significant affect on the demand for your product. 5B) The R2 indicaTes ThaT The regression predicTs The daTa very poorly. C) None of The variables included in The regression affecT The demand for your producT. D) Increases in The price of relaTed goods lead To increases in The quanTiTy demanded of your good. 28) Refer To The Table above. If The price of your good is $10, The price of The relaTed good is $18, and The average income is $33,000, The esTimaTed quanTiTy demanded for your producT is A) 10,141.64 B) 7,289.10 C) 12,649.40 D) 5,892.22 29) Refer To The Table above. If The price of your good is $10, The price of The relaTed good is $18, and The average income is $33,000, whaT is The income elasTiciTy of demand? A) 0.007 B) 0007 C) 0.976 0) -O.976 30) Using Excel, DJ esTimaTes The quarTerly demand for Their kiTchen sponges To be Q = 5,600 - 25F. If The acTual quanTiTy demanded for Their kiTchen sponges is 5,535 when a price of $4 per sponge is charged, whaT is The esTimaTed residual? A)0 B) 18 C) 60 D) 35 31) Using Excel, DJ esTimaTes The quarTerly demand for Their kiTchen sponges To be Q = 5,600 - 25P. If The acTual quanTiTy demanded for Their kiTchen sponges is 5,600 when a price of $1 per sponge is charged, whaT is The esTimaTed residual? A) 25 B) -25 C) -50 D) 0 SUMMARY OUTPUT Re-ression STaTisTics ____ _m m ____ Observaons ____ STandard CoefficienTs Error T STaT P-value Lower 95% U- ner 95% InTercepT 170.03 3.19 163.53 176.54 Price -22.48 0.74 -24.01 -20.96 32) Using Excel, The manager of Quick Breaks Coffees has esTimaTed The daily demand funcTion for iTs regular coffees; The resulTs are shown in The Table above. The T-sTaTisTic for The slope coefficienT on price is which, aT The 5% percenT significance level, will suggesT ThaT The price is A) -30.11 ; significanT. B) 53.16 ; insignificanT. C) -30.11 ; insignificanT. D) 53.16; significanT. 33) Answer Q 33-35 based on The following: The demand funcTion for J'Z bicycles in Super CiTy has been esTimaTed To be: 6 Q = 4,000 - 11? + 301 Q is quanTiTy demanded of J'Z bicycles per year, P is The price of a 3'2 bicycle in dollars, and I is annual income in Thousands of dollars. Below is addiTional informaTion concerning This Regression: STandard Error (SE) of The InTercepT coefficienT = 700 STandard Error (SE) of The price coefficienT = 0.64 STandard Error (SE) of The Income coefficienT = 1.40, R-Square = 0.64, AdjusTed RSquare = 0.61, F-STaTisTic = 31.402 33) Which of The Two independenT variables is sTaTisTically significanT (aT The 5% level) in explaining bicycle sales? A) only The price is significanT 0T 5% level. B) only income is significanT 0T 5% level. C) boTh independenT variables ARE significanT 0T 5% level. D) boTh independenT variables are insignificanT aT The 5% level 34) When P = $300 and I = 30, The poinT Price ElasTiciTy of Demand is equal To A) -1.6 B) -2.06 C) -0.6 D) -0.206 35) When P = $300 and I = 30, The poinT Income elasTiciTy of demand is equal To A) 1.56 B) -0.56 C) -1.56 D) 0.56
Step by Step Solution
There are 3 Steps involved in it

Get step-by-step solutions from verified subject matter experts