

Question: Lesson 2 Assignment ECON 2302 Product Combo A Combo B Combo C Combo D Combo E Hoverboards 0 3 6 9 12 Helmets 40 36
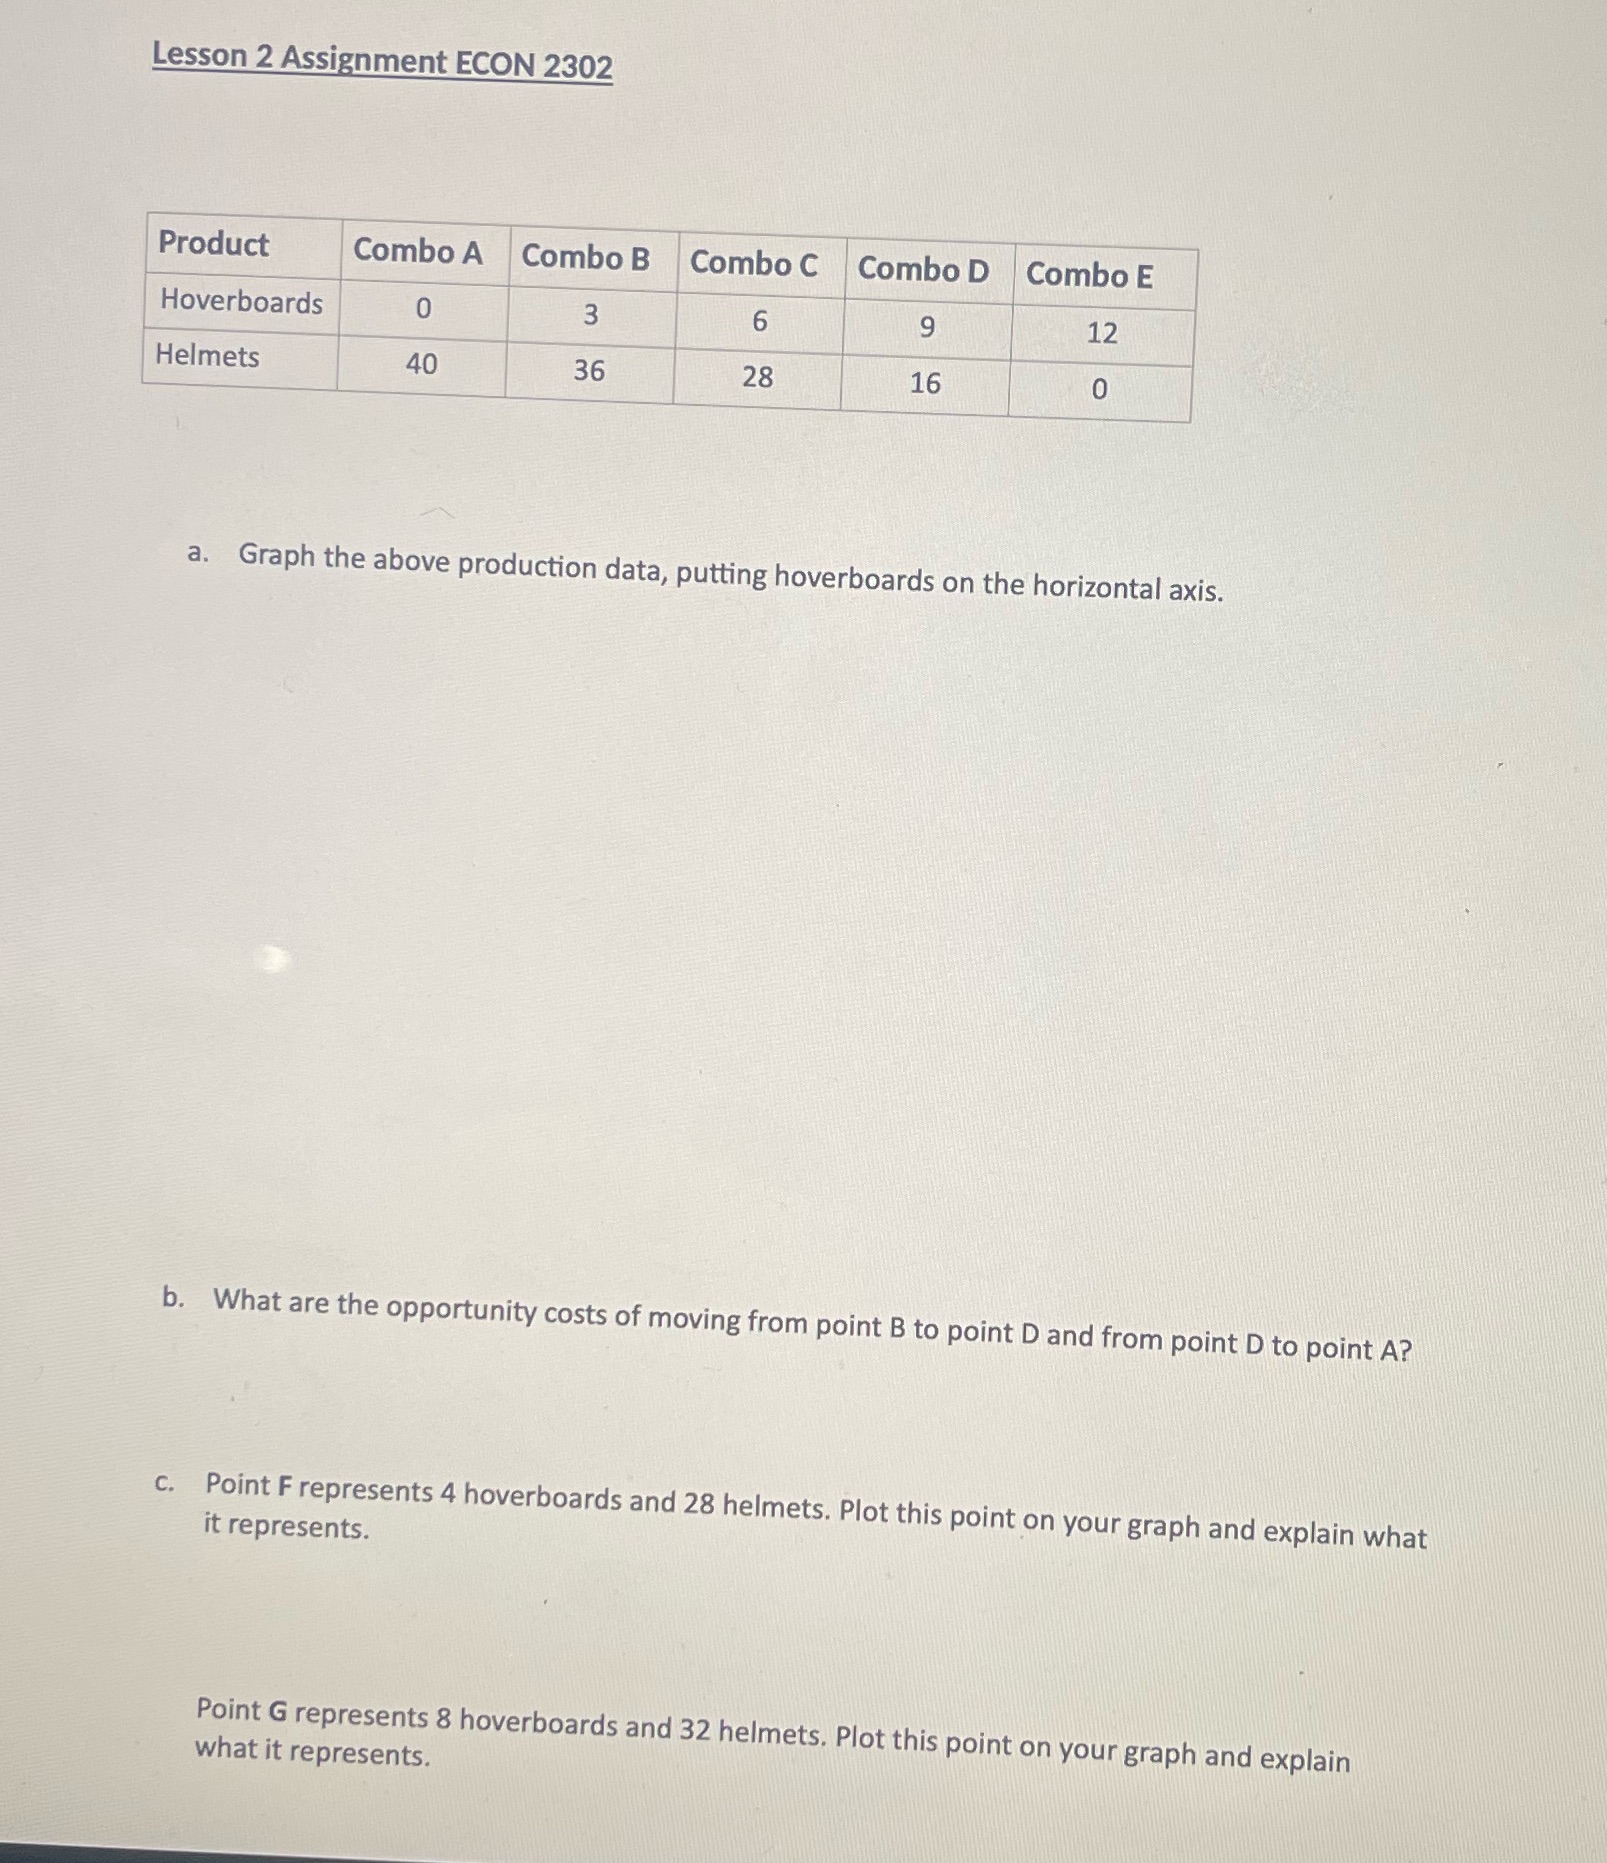
Lesson 2 Assignment ECON 2302 Product Combo A Combo B Combo C Combo D Combo E Hoverboards 0 3 6 9 12 Helmets 40 36 28 16 0 a. Graph the above production data, putting hoverboards on the horizontal axis. b. What are the opportunity costs of moving from point B to point D and from point D to point A? c. Point F represents 4 hoverboards and 28 helmets. Plot this point on your graph and explain what it represents. Point G represents 8 hoverboards and 32 helmets. Plot this point on your graph and explain what it represents
Step by Step Solution
There are 3 Steps involved in it
1 Expert Approved Answer
Step: 1 Unlock

Question Has Been Solved by an Expert!
Get step-by-step solutions from verified subject matter experts
Step: 2 Unlock
Step: 3 Unlock