

Question: Lesson 8 EP (Extra Credit) Help Save & Check 7 AA 12-2 Comparative Analysis LO A1 Key figures for Apple and Google follow 10 point
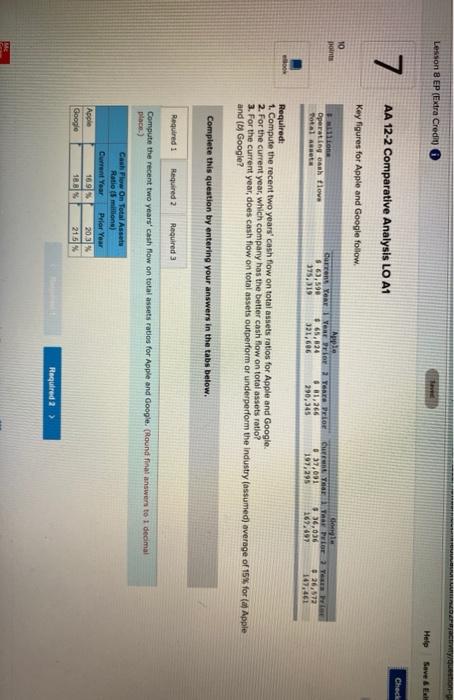
Lesson 8 EP (Extra Credit) Help Save & Check 7 AA 12-2 Comparative Analysis LO A1 Key figures for Apple and Google follow 10 point Lone Operating cash flow Total asuta Apple Current YonneRE POR 2 Tere Pro $ 63,590 65,024 81,266 375,119 321,606 290,345 Currency Tar Por Yes Le 37.001 # 36,036 26,572 197,295 169.497 147.461 Required: 1. Compute the recent two years' cash flow on total assets ratios for Apple and Google. 2. For the current year, which company has the better cash flow on total assets ratio? 3. For the current year, does cash flow on total assets outperform or underperform the industry fassumed) average of 15% for ( Apple and (Google? Complete this question by entering your answers in the tabs below. Required 1 Required 2 Required 3 Compute the recent two years cash flow on total assets ratios for Apple and Google. (Round fint answers to 1 decimal place.) Cash Flow On Total Assets Ratio million) Current Year Prior Year 16 91 20.31% 18.8% 215% Apple Google Required 2 >
Step by Step Solution
There are 3 Steps involved in it

Get step-by-step solutions from verified subject matter experts