

Question: lest 2 Winter 2022 X Time Limit: 2:00:00 Time Left:1:57:51 Hitesh Maheshwari: Attempt 1 Page 1: The Speedy Oil Change Company advertised 35 minute wait
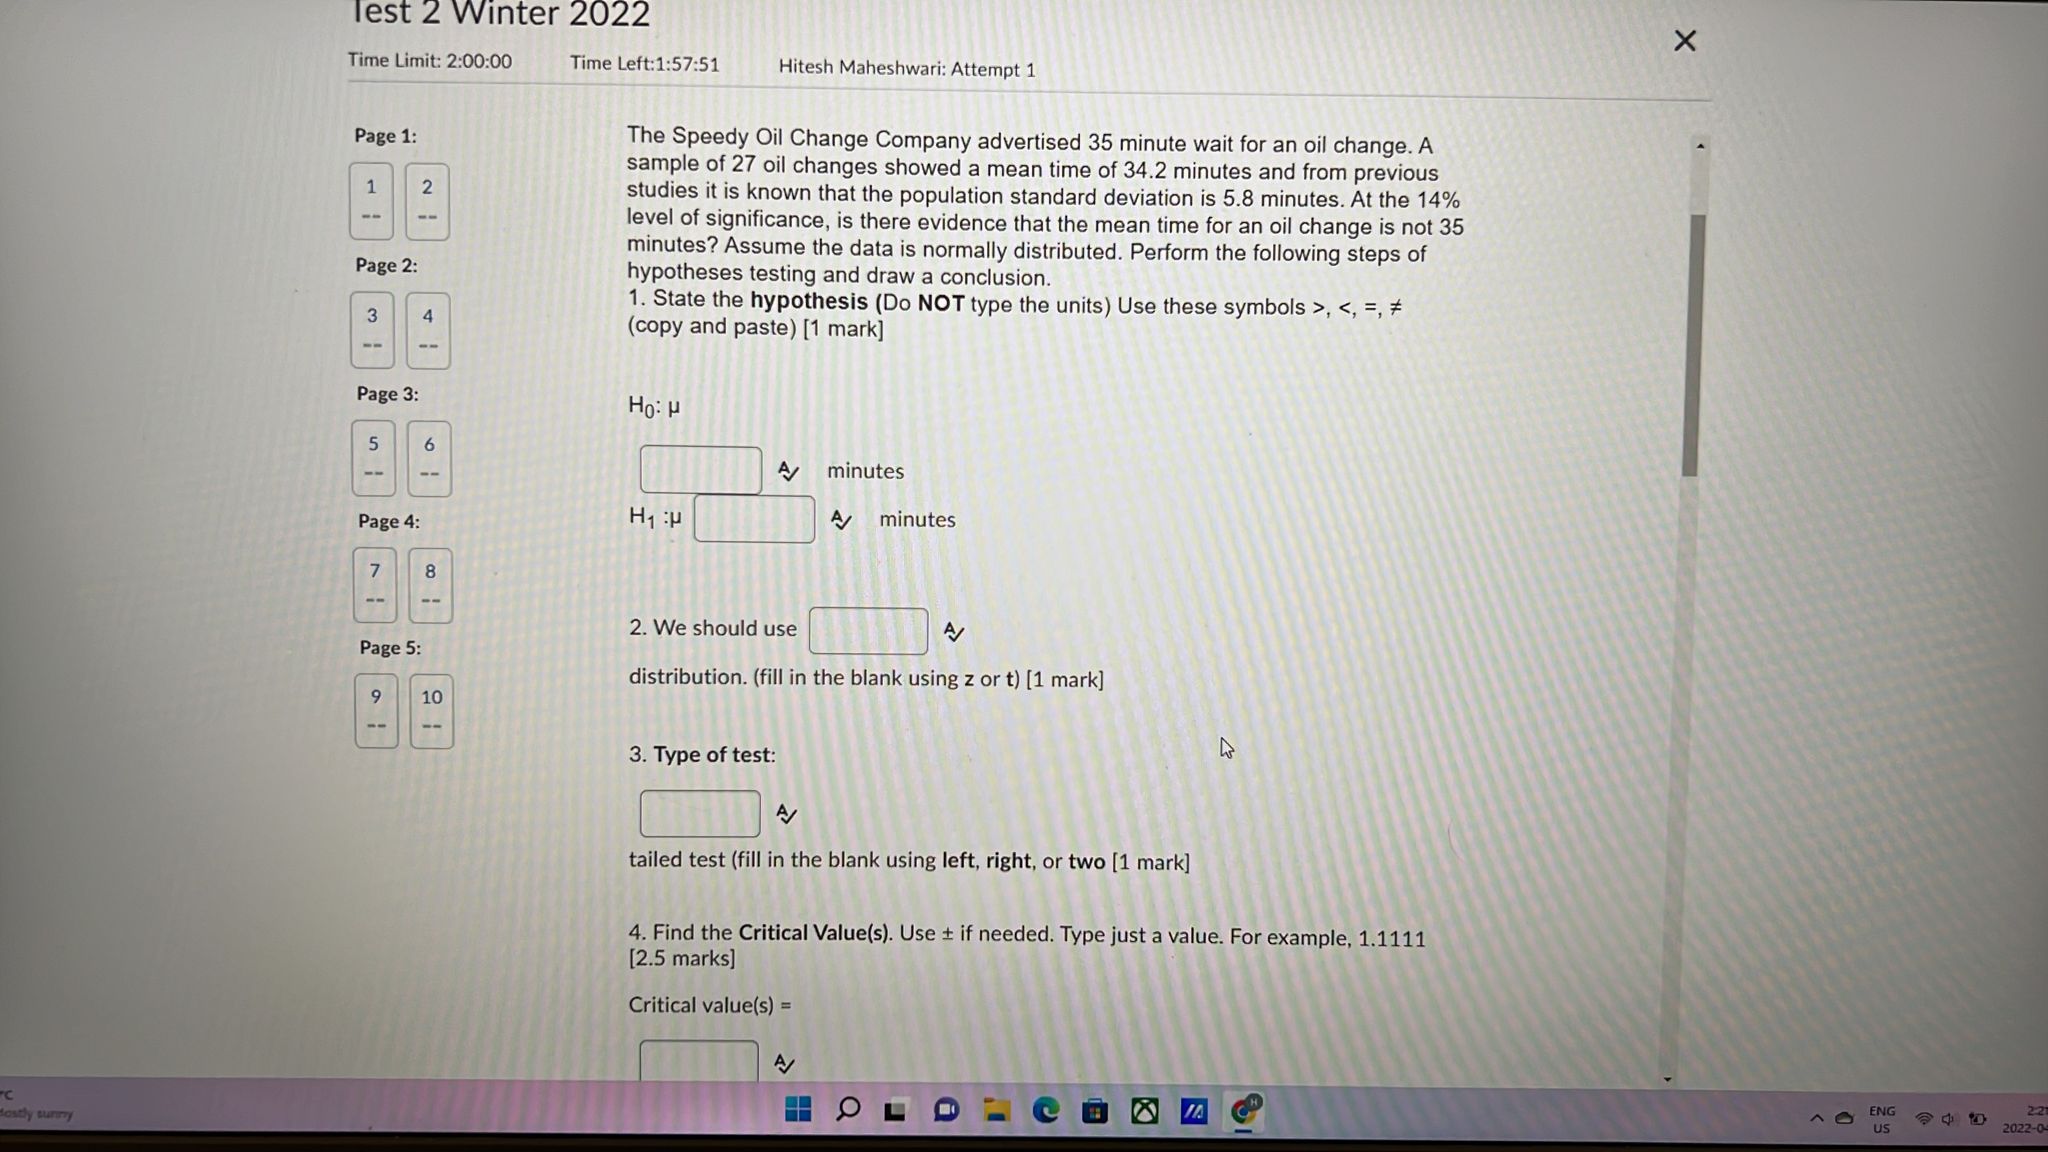


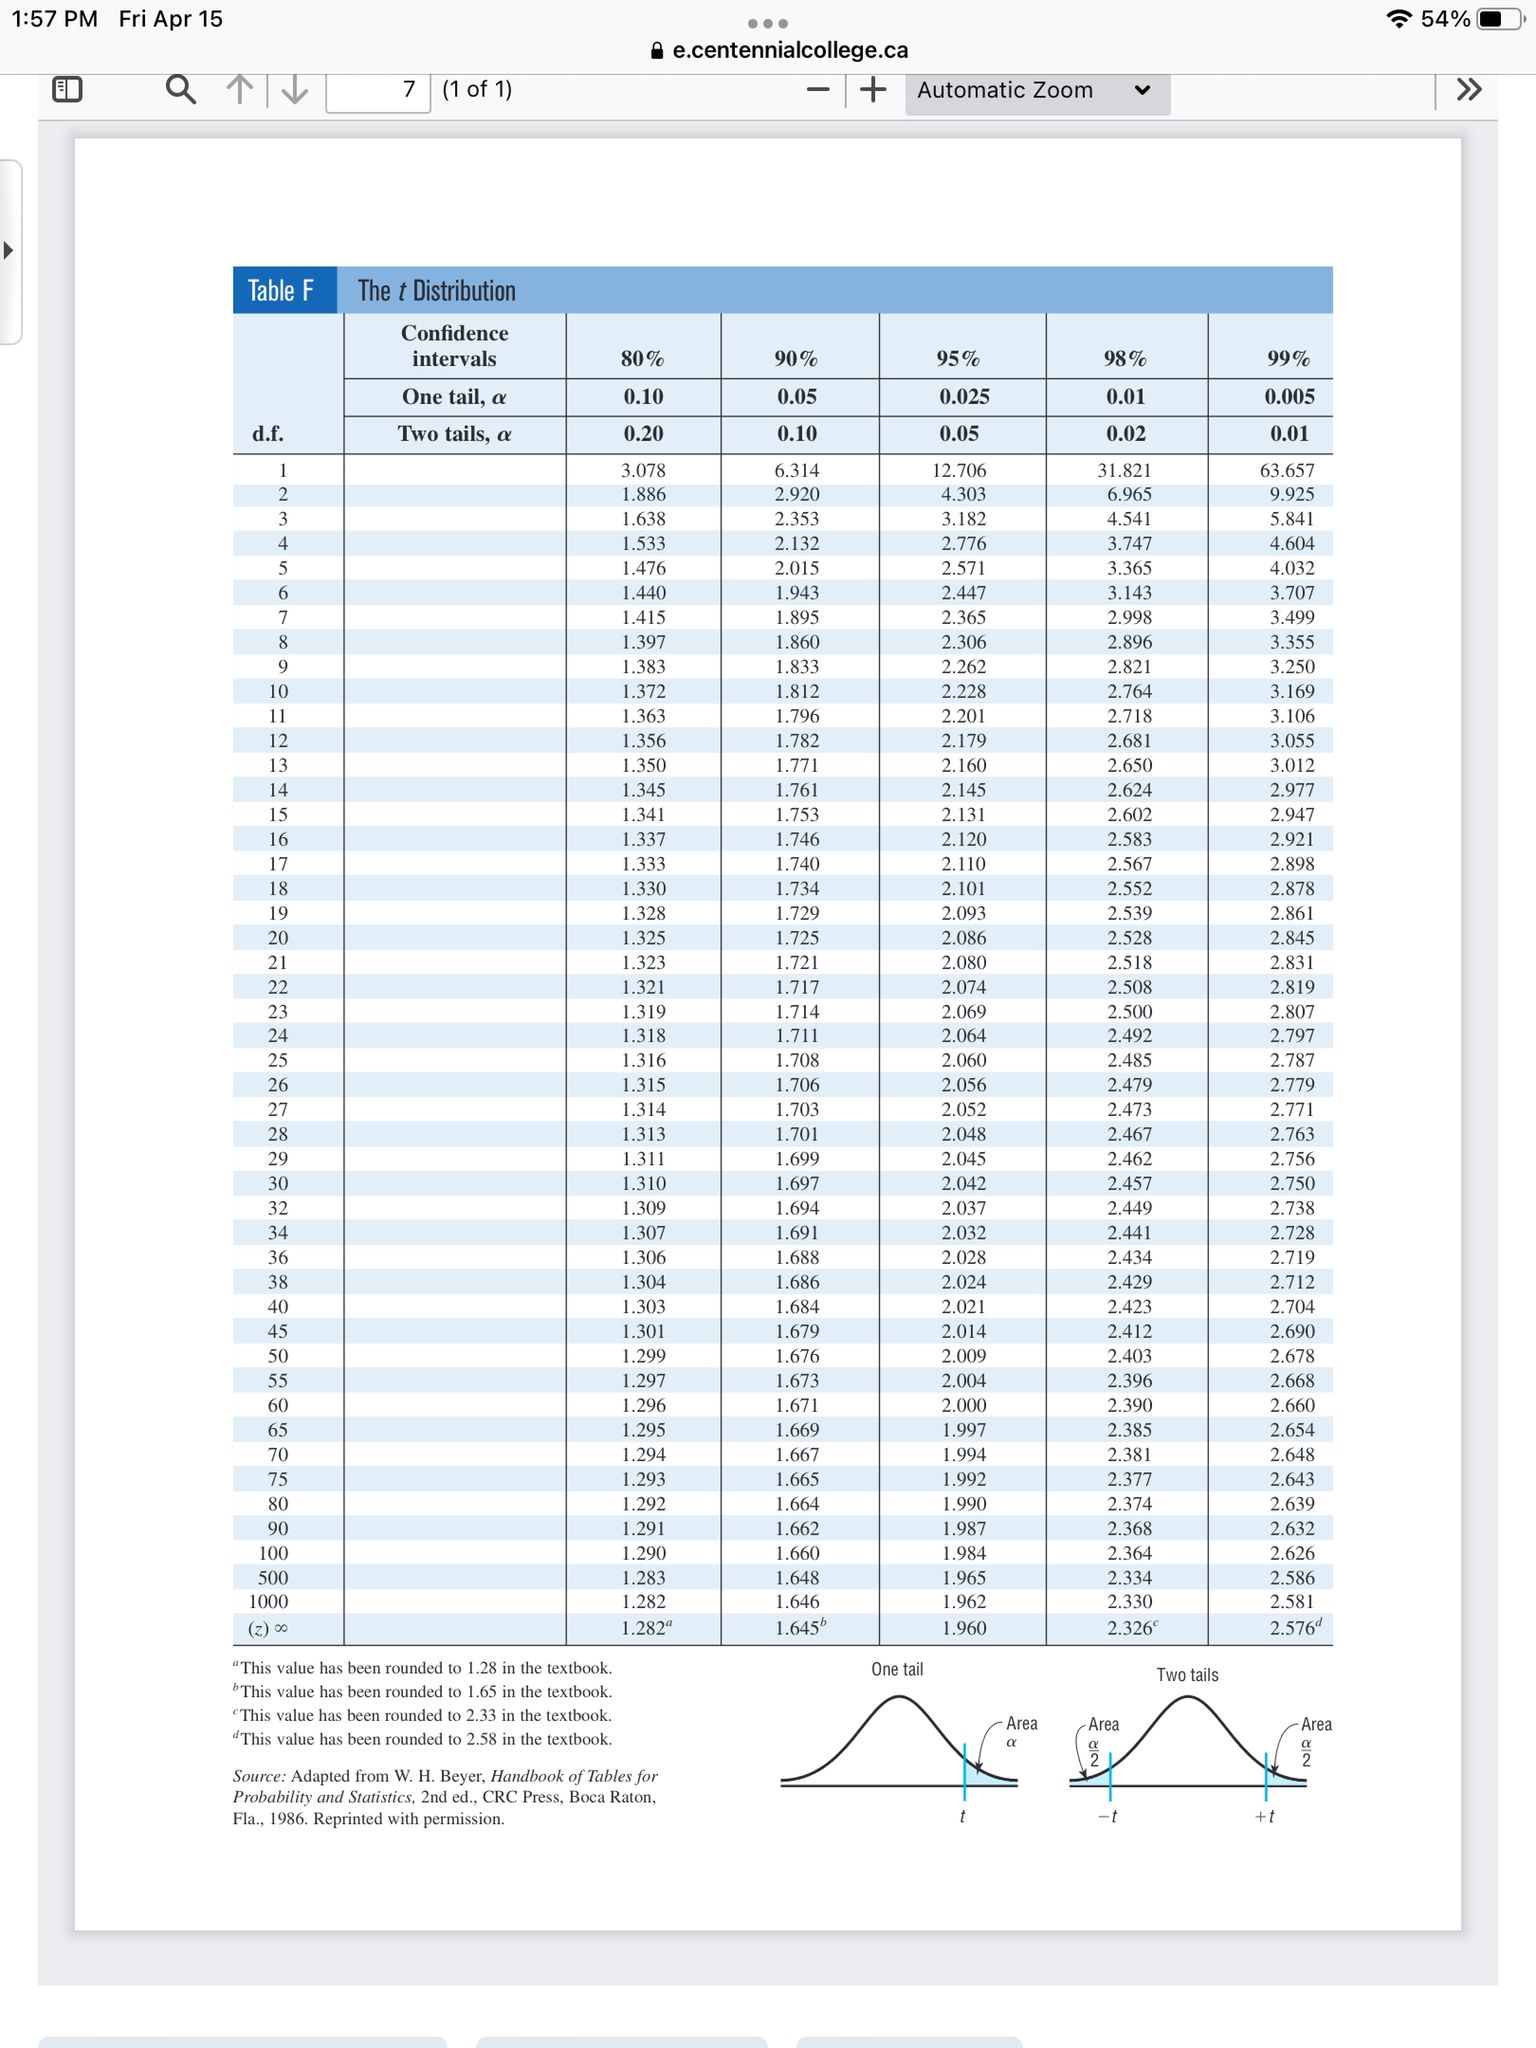
lest 2 Winter 2022 X Time Limit: 2:00:00 Time Left:1:57:51 Hitesh Maheshwari: Attempt 1 Page 1: The Speedy Oil Change Company advertised 35 minute wait for an oil change. A sample of 27 oil changes showed a mean time of 34.2 minutes and from previous 1 2 studies it is known that the population standard deviation is 5.8 minutes. At the 14% level of significance, is there evidence that the mean time for an oil change is not 35 minutes? Assume the data is normally distributed. Perform the following steps of Page 2: hypotheses testing and draw a conclusion. 1. State the hypothesis (Do NOT type the units) Use these symbols >, , > Table F The t Distribution Confidence intervals 80% 90% 95% 98% 99% One tail, a 0.10 0.05 0.025 0.01 0.005 d.f. Two tails, a 0.20 0.10 0.05 0.02 0.01 3.078 6.314 2.70 31.82 3.657 1.886 2.920 4.303 6.965 9.925 1.638 2.353 3.182 4.54 5.841 1.533 2.132 2.776 3.747 4.604 JaUAWN 1.476 2.015 2.571 3.365 4.032 1.440 1.943 2.447 3.143 3.707 1.415 1.895 2.365 2.998 3.490 0 00 N 1.397 1.860 2.306 2.896 3.355 1.383 1.833 2.262 2.821 3.250 10 1.372 1.812 2.228 2.764 3.169 11 1.363 1.796 2.201 2.718 3.106 1.356 1.782 2.179 2.681 3.055 1.350 1.771 2.160 2.650 3.012 1.345 1.761 2.145 2.624 2.977 1.341 1.753 2.131 2.602 2.947 1.337 1.746 2. 120 2.583 2.921 1.333 1.740 2.110 2.567 2.898 1.330 1.734 2. 101 2.552 2.878 1.328 1.729 2.093 2.861 1.325 1.725 2.086 2.528 2.845 1.323 1.721 2.080 2.518 2.831 1.321 1.717 2.074 2.508 2.819 1.319 1.714 2.069 2.500 2.807 1.318 1.711 2.064 2.492 2.797 1.316 1.708 2.060 2.485 2.787 1.315 1.706 2.056 2.479 2.779 1.314 1.703 2.052 2.473 2.771 1.313 1.701 2.048 2.467 2.763 1.311 1.699 2.045 2.462 2.756 1.310 1.697 2.042 2.457 2.750 1.309 1.694 2.037 2.449 2.738 1.307 1.691 2.032 2.441 2.728 1.306 1.688 2.028 2.434 2.719 1.304 1.686 2.024 2.429 2.712 40 1.303 1.684 2.021 2.423 2.704 45 1.301 1.679 2.014 2.412 2.690 50 1.299 1.676 2.009 2.403 2.678 55 1.297 1.673 2.004 2.396 2.668 60 1.296 1.671 2.000 2.390 2.660 65 1.295 1.669 1.997 2.385 2.654 70 1.294 1.667 1.994 2.381 2.648 75 1.293 1.665 1.992 2.377 2.643 80 1.292 1.664 1.990 2.374 2.639 90 1.291 1.662 1.987 2.368 2.632 100 1.290 1.660 1.984 2.364 2.626 500 1.283 1.648 1.965 2.334 2.586 1000 1.282 1.646 1.962 2.330 2.581 2) 00 1.282 .645% 1.960 2.326' 2.576d "This value has been rounded to 1.28 in the textbook. One tail Two tails "This value has been rounded to 1.65 in the textbook. "This value has been rounded to 2.33 in the textbook. Area Area - Area "This value has been rounded to 2.58 in the textbook. 2 Source: Adapted from W. H. Beyer, Handbook of Tables for Probability and Statistics, 2nd ed., CRC Press, Boca Raton, Fla., 1986. Reprinted with permission
Step by Step Solution
There are 3 Steps involved in it

Get step-by-step solutions from verified subject matter experts