

Question: Let f(x) be the piecewise-continuous function shown in the graph. y = flux) a) Compute L2 and R2, the left-endpoint and right-endpoint Riemann sum approximations
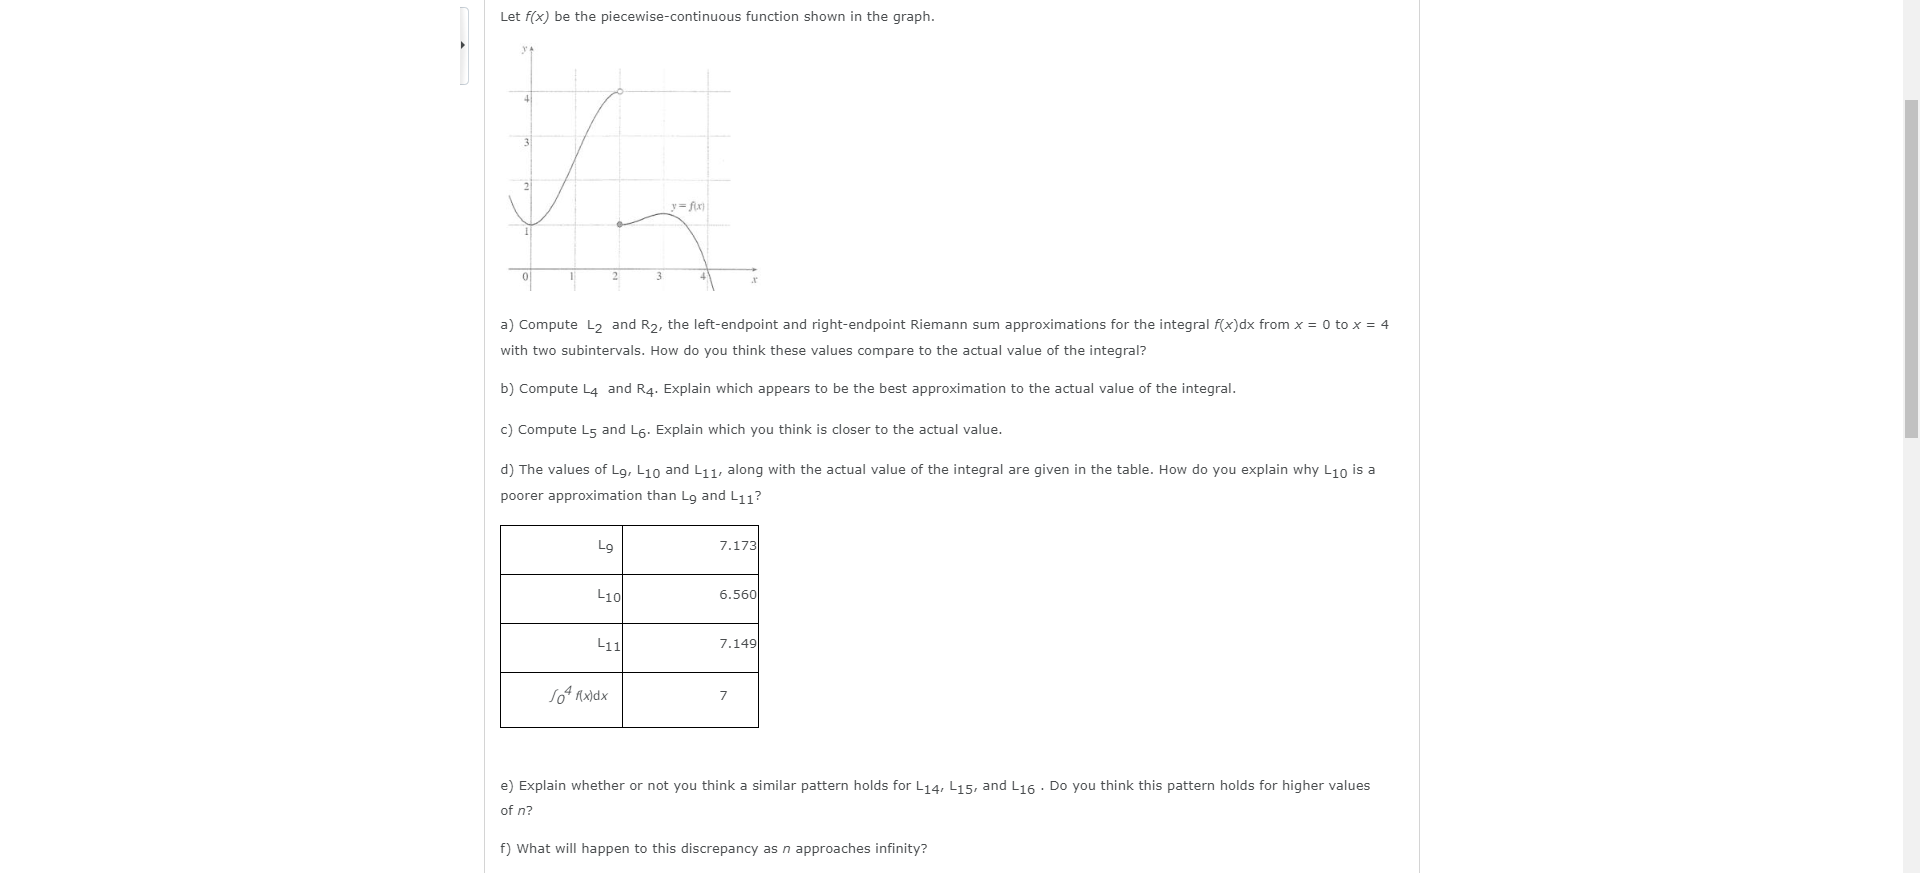
Let f(x) be the piecewise-continuous function shown in the graph. y = flux) a) Compute L2 and R2, the left-endpoint and right-endpoint Riemann sum approximations for the integral f(x)dx from x = 0 to x = 4 with two subintervals. How do you think these values compare to the actual value of the integral? b) Compute L4 and R4. Explain which appears to be the best approximation to the actual value of the integral. c) Compute L5 and L6. Explain which you think is closer to the actual value. d) The values of L9, Lio and L11, along with the actual value of the integral are given in the table. How do you explain why L10 is a poorer approximation than Lo and L11? Lo 7.173 L10 6.560 L11 7.149 104 Axdx e) Explain whether or not you think a similar pattern holds for L14, L15, and L16 . Do you think this pattern holds for higher values of n? f) What will happen to this discrepancy as n approaches infinity
Step by Step Solution
There are 3 Steps involved in it

Get step-by-step solutions from verified subject matter experts