

Question: Let n, = 80, X1 = 60, n2 = 80, and X2 = 50. Complete parts (a) and (b) below. . . . a. At


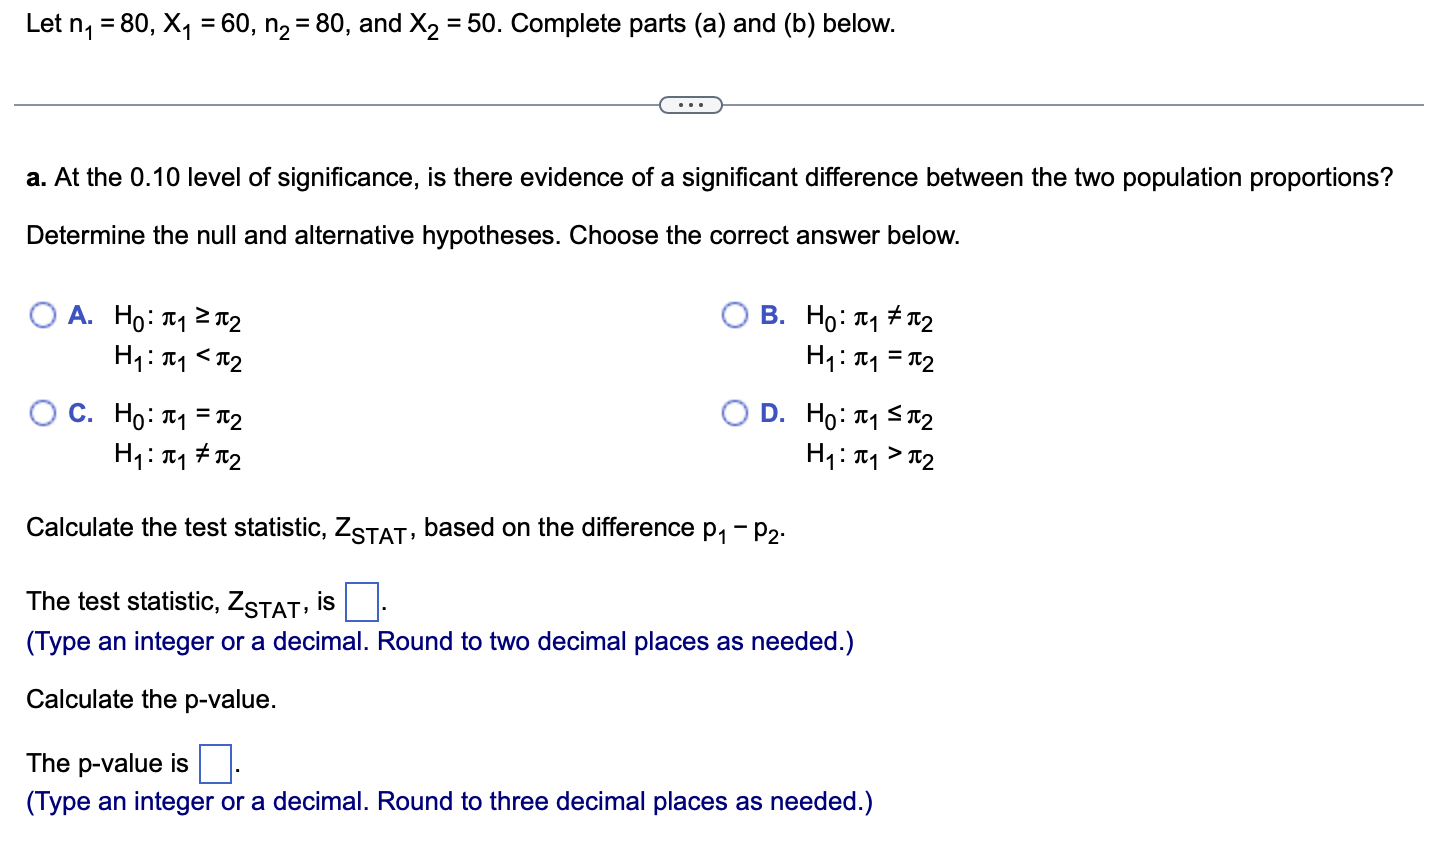
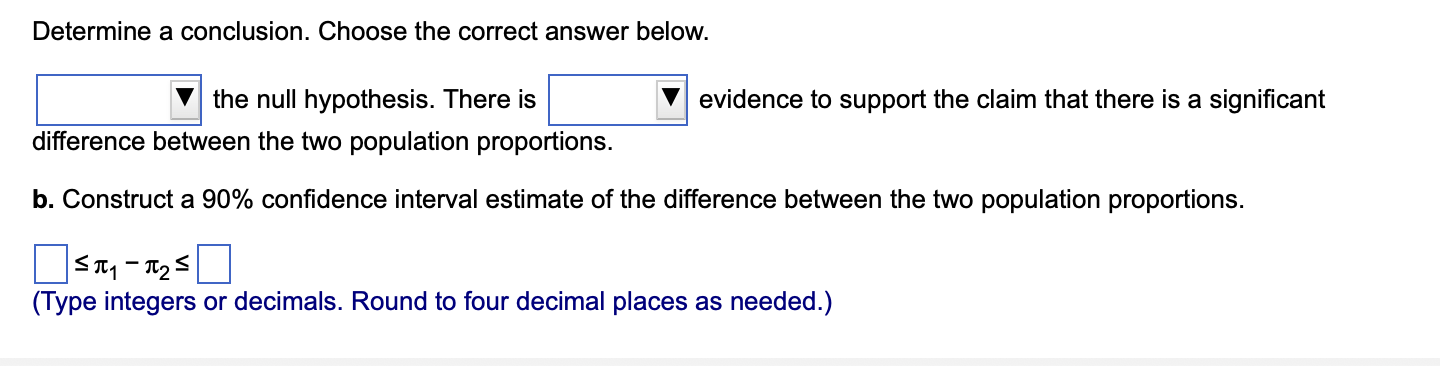
Let n, = 80, X1 = 60, n2 = 80, and X2 = 50. Complete parts (a) and (b) below. . . . a. At the 0.10 level of significance, is there evidence of a significant difference between the two population proportions? Determine the null and alternative hypotheses. Choose the correct answer below. O A. HO: T1 2 12 OB. HO: my # 1 2 H1 : 1 1 1 2 Calculate the test statistic, ZSTAT, based on the difference P1 - P2. The test statistic, ZSTAT, is (Type an integer or a decimal. Round to two decimal places as needed.) Calculate the p-value. The p-value is (Type an integer or a decimal. Round to three decimal places as needed.)Determine a conclusion. Choose the correct answer below. the null hypothesis. There is evidence to support the claim that there is a significant difference between the two population proportions. b. Construct a 90% confidence interval estimate of the difference between the two population proportions. (Type integers or decimals. Round to four decimal places as needed.)
Step by Step Solution
There are 3 Steps involved in it

Get step-by-step solutions from verified subject matter experts